Research Article
Impact of Dietary Immunostimulants on Morphometric and Haematological Responses of Catla catla (Hamilton, 1822) Challenged with Aeromonas hydrophila 
 ,
Sriteja G. ,
Sunita K.
,
Sriteja G. ,
Sunita K.  Author Correspondence author
International Journal of Aquaculture, 2026, Vol. 16, No. 4 doi: 10.5376/ija.2026.16.0020
Received: 26 Jun., 2026 Accepted: 11 Aug., 2026 Published: 20 Aug., 2026
Eisay Ali K.A., Sriteja G., and Sunita K., 2026, Impact of dietary immunostimulants on morphometric and haematological responses of Catla catla (Hamilton, 1822) challenged with Aeromonas hydrophila, International Journal of Aquaculture, 16(4): 243-281 (doi: 10.5376/ija.2026.16.0020)
Aquaculture is a rapidly expanding sector that contributes significantly to global food production by cultivating aquatic organisms under controlled conditions. However, a major obstacle to aquaculture is the widespread use of antibiotics since the emergence of antibiotic-resistant bacteria. Thus, the immunostimulants are replacing chemotherapeutic therapies for aquaculture disease control. In such a scenario, morphometric and haematological evaluations are necessary to check the impact of immunostimulants on the health of both healthy and pathogen-infected fish. Because of its high nutritional value and other beneficial effects on human health, Catla catla has been a popular cultured freshwater fish in India, limited information is available regarding the effects of dietary immunostimulants on Aeromonas hydrophila-challenged C. catla. Therefore, the study examined the effects of immunostimulants on C. catla morphometric and haematological parameters under normal and Aeromonas-infected conditions. This study found that oral administration of immunostimulants such as vitamin C, vitamin E, chitin, chitosan, and levamisole significantly increased body weight, feed intake, feed conversion, and biomass. Morphometric investigations demonstrated that immunostimulant-supplemented feed considerably affected body length, width, and weight. Among all the tested feeds, vitamin C showed the strongest growth-promoting effect under Aeromonas hydrophila infection. The haematological analysis demonstrated that immunostimulants substantially increased haemoglobin content, RBC, WBC, neutrophil, lymphocyte, monocyte counts, and ESR as well as decreased eosinophil count and do not exhibit any effect on basophil count. Among all the immunostimulants Vitamin E has shown more effect in improving the haematological parameters. In conclusion, immunostimulants promote C. catla growth, immunity, and survival under Aeromonas infection. Thus, among the above selected immunostimulants, Vitamin C and Vitamin E are more potent and can be used in developing alternative dietary strategies for improving fish health management and reducing dependence on antibiotics in aquaculture.
1 Introduction
Aquaculture is a rapidly expanding food production sector involving the cultivation of aquatic organisms under controlled (Ahmed and Thompson, 2019). The worldwide fish production in 2018 accounted for around 179 million tonnes, according to the Food and Agriculture Organization (FAO, 2020). Cultivated fish serve as a primary food supply for impoverished individuals, offering a cost-effective source of animal protein (Nolle et al., 2020). The global fishery stock is extensively depleted as a result of overfishing. Due to the growing human population, there is a need to enhance the productivity of aquaculture, which has become the main way of satisfying the growing demand for fish (Gephart et al., 2020).
Furthermore, the rise of antibiotic-resistant microbes poses a significant barrier to the widespread use of antibiotics. The administration of costly chemotherapeutic agents and antibiotics for managing diseases has faced major challenges due to their adverse effects, such as the accumulation of residues in tissues, the emergence of drug resistance, and immunosuppression. As a result, the market demand for antibiotic-treated food fish has decreased (Anderson and Jeney, 1992). Preventing disease is more preferable to intervening to suppress or stop the disease progression after it has commenced. Therefore, rather than using chemotherapeutic treatments, there is a growing focus on utilising immunostimulants as a means of controlling disease in aquaculture. The growing trend of exploring various synergistic approaches for minimising fish infections has led to the accelerating use of immunostimulants as an appealing and potential substitute for chemotherapeutants in aquaculture practices.
An immunostimulant is a substance that enhances the innate or non-specific immune response through direct interaction with immune system cells, leading to their activation. Immunostimulants can be categorised into various agents according to their source including bacterial preparations, polysaccharides, extracts from animals or plants, nutritional components, and cytokines (Sakai, 1999). Immunostimulants enhance the immune system, decrease vulnerability to disease, and protect fish against stress and diseases. This minimizes adverse environmental effects and lessens reliance on chemicals or pharmaceuticals. New developments indicate that probiotics and immunostimulants, which are environmentally friendly methods, can greatly improve fish cultivation and health management (Sakai, 1999).
Several recent studies of peer researchers such as Rodrıguez et al. (2003), Sahoo and Mukherjee (2001), and Smith et al. (2003) recommend incorporating the use of immunostimulants into the overall health management strategy. Immunostimulant elicit a strong and effective immune response against pathogenic organisms, including viruses, bacteria, fungi, and parasites, while exhibiting no risk of toxicity, carcinogenicity, or tissue residues (Bairwa et al., 2012). However, the effect of adding immunostimulants to fish is reliant on a number of factors such as the species, stage of development, kind of immunostimulant, and the dosage, which may vary depending on the animal’s growth (Ringo et al., 2010).
In addition, studying an organism’s response to a stressful event involves two types of responses: direct which affect biochemical and metabolic function, and indirect which affect the food chain, habitat accessibility, and behavioural changes (Adams, 2005). Finding and analysing biomarkers, especially in fish, has been recognised as a useful way to learn more about the state of stressed ecosystems and how they interact with aquatic life (Viarengo et al., 2007). Research studies indicate that immunostimulants can have beneficial impacts on the haematological parameters of fish. For instance, Hoseinifar et al. (2017) examined the impact of immunostimulants on the haematological parameters of rainbow trout, and they discovered that adding β-glucan, a widely used immunostimulant to fish’s food resulted in higher levels of white blood cells and haemoglobin concentration.
In this context, fish morphometric and haematological measurements have become useful diagnostic tools and promising stress indicators. These measurements are crucial for evaluating the overall health of fish and the intensity of stress-induced reactions. Thus, a morphometric and haematological assessment is required to screen for the effects of immunostimulants on the health of fish that are both normal and infected with pathogen. In India, there is a scarcity of information on the effect of immunostimulants on the Aeromonas-infected C. catla. C. catla exemplifies a successful cultivated freshwater species for consumption, attributed to its notable nutritional and health benefits (Ismail, 2005). Therefore, this study aimed to evaluate the effects of different dietary immunostimulants on growth performance, morphometric characteristics, and haematological responses of Catla catla particularly under Aeromonas hydrophila challenge conditions, compared with previous studies on other cultured fish species.
2 Materials and Methods
2.1 Collection and acclimatisation of fish samples
Live healthy and young C. catla fish samples, with an initial body weight of 142±10 g, were collected at a private farm (Longitude: 83º10' 14.88'' to 83º11' 6.72'' E; Latitude: 17º40' 23.52'' to 17º45' 57.6'' N) in K. Kotapadu village, Visakhapatnam, Andhra Pradesh, India, from December 2023 to January 2024. The live samples were carried to the lab in sterile zip pouches with pond water and maintained under regulated conditions. All fish were kept for two weeks to acclimatise to the laboratory environment. Fish were maintained in 50×30×40 cm plastic containers with aerated, dechlorinated tap water.
2.2 Experimental design
A study was performed to assess the effects of five dietary immunostimulants, namely vitamin C, vitamin E, chitin, chitosan, and levamisole, on the growth performance, morphometric characteristics, and haematological responses of C. catla. The experiment was carried out with four distinct groups as follows:
Group 1 (Control): The first group of fish was fed GrowFin fish feed without any immunostimulants and is referred to as the control group.
Group 2 (Immunostimulant Fed): The second cohort of fish was subsequently partitioned into five experimental sub-groups, each receiving a distinct diet supplemented with a particular immunostimulant.
Group 3 (A. hydrophila infected): In the third group, the fish were fed a control diet and infected with a concentrated A. hydrophila culture at a dosage of 200 μL/L (106 CFU/mL).
Group 4 (A. hydrophila infected + Immunostimulant Fed/ Treated): In the fourth treatment group, the fish were further divided into five experimental sub-groups. Each group was infected with A. hydrophila like third group and fed independently with five selected immunostimulant mixed feeds.
In each experimental group (n=10), the fish were administered 3 gm of feed at 12-hour intervals. The water temperature and pH were calibrated at 25℃ and 5.6, respectively. The photoperiod is established at 12 hours of light and 12 hours of darkness. Aerators were affixed to tubs to enhance aeration. Every day, half of the water in the tub was replaced with fresh, dechlorinated tap water, and the fish were maintained for one month in all the experimental groups. Following 30 days of exposure, fish were sacrificed with the objective of conducting growth performance, morphometric, and haematological assessments.
2.3 Measurements of growth performance
The initial measurement of length, weight, and other morphometric characteristics of all fish groups were done at the beginning of the experiment. Then the fish in all the treatment groups were allowed to grow for one month. Subsequently, the fish were sacrificed, and all growth parameters were recorded to determine their growth performance. The growth performance was assessed by measuring the total biomass gain (TBG), weight gain (WG), and feed conversion ratio (FCR) using the following formulas.


2.4 Measurements of morphometric parameters
Morphometrics refers to the quantitative measurements of the dimension such as length, width, and height of the body or specific body portions of a fish. Morphometric measurements were obtained from fish in all the treatment groups at the beginning and end of the experiment. The morphometric characters were measured encompassing 14 specific traits including Body Length (BL), Body Width (BW), Body Depth (BD), Weight (W), Head Length (HL), Head Depth (HD), Eye Diameter (ED), Pupil Diameter (PD), Caudal Peduncle Length (CPL), Caudal Peduncle Depth (CPD), Caudal Fin Length (CFL), Dorsal Fin Length (DFL), Pectoral Fin Length (PcFL), Pelvic Fin Length (PlFN), and Anal Fin Length (Haryono, 2001).
2.5 Estimation of haematological parameters
2.5.1 Collection of blood
Following the end of the experiment, blood samples were obtained from the fish in all of the experimental groups. The blood sample was collected from the caudal vein, located just beyond the anal fin, by injecting a disposable syringe into the muscle tissues at a right angle to the ventral surface of the fish until the blood was drawn into the syringe. Following that, the collected blood was transferred into a vial containing EDTA and placed in a freezer.
2.5.2 Preparation and estimation of haemoglobin
The haemoglobin fraction was isolated using the methodology outlined by Adisa et al. (2004) based on the principle of hypotonic lysis. To extract haemoglobin, the blood from all the fish in each treatment group were taken in a separate centrifuge tube and centrifuged at 3000 rpm for 10 minutes. After centrifugation, the RBC pellet was washed three times with a 0.14 M NaCl solution. Followed by washing, the RBC cell pellet was dissolved in phosphate buffer saline. Then one volume of RBC suspension was lysed by adding two volumes of 0.01M phosphate buffer (pH 7.4) and 0.5 volume of CCl4. The haemolysate was further purified by centrifugation at 2300 rpm for 15 minutes at room temperature to remove any debris. The fraction with a high concentration of haemoglobin, specifically the upper layer was isolated and used to estimation of haemoglobin. The cyanmethemoglobin method, which is internationally recommended, was employed for determining the quantity of haemoglobin. 5 mL of cyanmethemoglobin reagent (Drabkin’s solution) was transferred into sterilised test tubes. Subsequently, 20 μL of hemolysate from each of the experimental group fish were added separately to the tubes. Following that, the tubes were gently agitated and allowed to kept for 10 minutes at room temperature. After the incubation, the absorbance was measured in a spectrophotometer at 540 nm.
2.6 Determination of total RBC and WBC counts
The enumeration of RBC and WBC was performed using a Neubauer hemocytometer, following the methodology described by Martins et al. (2004).


2.7 Enumeration of differential leucocytes count
The differential blood count of the fish from each experimental group was conducted using the procedure outlined by Hudson and Hay (1991). To carry out this experiment, a minute quantity of blood was placed on a glass slide, and a thin smear was made by using oil and a spreader slide. Afterward, the blood smear was allowed to dry in the air, and then the slide was treated with Leishman’s stain. The slide was incubated for 5 minutes and subsequently diluted with distilled water, followed by an additional incubation period of 10 minutes. After staining, the slides were rinsed with tap water and left to air dry. Finally, the slides were examined by placing them under the microscope.
2.8 Assessment of erythrocyte sedimentation rate (ESR)
The ESR of the fish from all the experimental groups was determined using the Westergren method. In order to perform ESR, the blood drawn from each sample was transferred into a Westergren-Katz tube up to the 200 mm mark immediately following blood collection. Subsequently, the tube was positioned vertically in a rack and left undisturbed for 1 hour at room temperature. During this period, measurements of the distance between the lowest point of the surface meniscus and the topmost layer of the red cell sediment were taken. The ESR is a measure of the distance that erythrocytes decrease in millimetres over the course of one hour.
2.9 Statistical analysis
Results were given as Mean ± Standard Deviation (SD) obtained from three independent experiments, and the data was assessed by one-way analysis of variance (ANOVA). The ‘p’ values less than 0.05, 0.01 and 0.001 were considered as significant, highly significant and extremely significant difference between the groups.
3 Results
3.1 Growth performance
The growth performance of the fish in all of the treatment groups was assessed by measuring the total biomass gain (TBG), weight gain (WG), and feed conversion ratio (FCR).
3.1.1 Total biomass gain
The total biomass gain after 1 month of feeding with different immunostimulant-supplemented feeds such as vitamin C, vitamin E, chitin, chitosan, and levamisole under exposure to Aeromonas hydrophila was shown in Table 1 and Figure 1. From these results, it was observed that the fish fed with vitamin E mixed feed exhibited greater biomass gain, whereas fish fed with chitin mixed feed exhibited lowest biomass gain. The fish fed with control diet showed the biomass gain of 2.53 kg m-3, while the fish which are infected with A. hydrophila and fed with control diet exhibited the total biomass gain of 2.13 kg m-3.
.png) Table 1 Growth performance of Catla catla with different immunostimulant-supplemented feeds under healthy and Aeromonas hydrophila infected conditions Table notes: TBG – total biomass gain, WG – weight, FCR – feed conversion ratio |
.png) Figure 1 The total biomass gain with different immunostimulant-supplemented feeds under normal and Aeromonas hydrophila infected conditions |
Furthermore, all the immunostimulant mixed feed significantly increases the total biomass gain when compared to the control groups. The total biomass gain in the fish fed with selected immunostimulant feeds such as vitamin C, vitamin E, chitin, chitosan, and levamisole were found to be 3.33, 6.27, 2.8, 3.73, and 4.1 kg m-3 respectively.
Whereas total biomass gain in the A. hydrophila infected fish fed with immunostimulant feeds such as vitamin C, vitamin E, chitin, chitosan, and levamisole were found to be 2.93, 3.23, 2.66, 3.06, and 3.46 kg m-3 respectively.
According to these results, vitamin E has a greater growth promoting properties than the other immunostimulant feeds, whereas under Aeromonas exposure, levamisole shows greater biomass gain. Furthermore, when compared to the Aeromonas infected fish with control diets, the fish fed with immunostimulant mixed feeds exhibited greater biomass gain.
3.1.2 Weight gain
The weight gain after 1 month of feeding with different immunostimulant-supplemented feeds such as vitamin C, vitamin E, chitin, chitosan, and levamisole under exposure to A. hydrophila was shown in Figure 2 and Table 1. From these results, it was observed that the fish fed with immunostimulant mixed feed exhibited greater weight gain than the fish fed with control feed.
.png) Figure 2 Weight gain with different immunostimulant-supplemented feeds under normal and Aeromonas hydrophila infected conditions |
Furthermore, among all the tested immunostimulants, fish fed with vitamin E mixed feed exhibited greater weight gain. However, lowest weight gain was observed in Aeromonas infected fish fed with vitamin E. The fish fed with control diet shows the weight gain of 18.7 g, while the fish which are infected with and A. hydrophila and fed with control diet exhibited the weight gain of 15.58 g.
Furthermore, all the immunostimulant mixed feed significantly increased the weight gain when compared to the control groups. The weight gain in the fish fed with selected immunostimulant feeds such as vitamin C, vitamin E, chitin, chitosan, and levamisole were found to be 24.8, 47.5, 20.5, 28.1, and 30.8 g respectively.
Whereas, weight gain in the A. hydrophila infected fish fed with immunostimulant feeds such as vitamin C, vitamin E, chitin, chitosan, and levamisole were found to be 21.9, 15.6, 20.2, 22.8, and 26 g respectively. According to these results, vitamin E has a greater growth promoting properties than the other immunostimulant feeds under normal conditions, whereas under Aeromonas exposure, levamisole shows greater weight gain. Furthermore, when compared to the Aeromonas infected fish with control diets, the fish fed with immunostimulant mixed feeds exhibited significantly increased weight gain.
Moreover, the fish fed with immunostimulant mixed feeds exhibited greater weight gain than the fish fed with control feed. The highest weight gain was observed in fish fed with vitamin E supplemented feed. After 30 days of treatment, the weight gain of fish fed with control feed as well as vitamin C, vitamin E, chitin, Chitosan, and levamisole supplemented feeds were found to be 18.7, 24.8, 47.5, 20.5, 28.1, and 30.8 g respectively. These results demonstrated that the vitamin C, vitamin E, and levamisole had the greater growth promoting properties.
3.1.3 Feed conversion ratio
Feed Conversion Ratio (FCR) is a metric that quantifies the amount of feed consumed by an animal relative to the weight gained by the animal within a specific time frame. Smaller FCR values suggest that a feed is turned into fish weight gain efficiently, but overfeeding or underfeeding increases the ratio (Bai et al., 2022).
The feed conversion ratio after 1 month of feeding with different immunostimulant-supplemented feeds such as vitamin C, vitamin E, chitin, chitosan, and levamisole under exposure to A. hydrophila was shown in Figure 3 and Table 1. From these results, it was observed that the fish fed with immunostimulant mixed feed exhibited lower FCR weight gain than the fish fed with control feed.
.png) Figure 3 Feed Conversion Ratio (FCR) with different immunostimulant-supplemented feeds under normal and Aeromonas hydrophila infected conditions |
Furthermore, among all the tested immunostimulants, fish fed with vitamin E mixed feed exhibited lower FCR, whereas highest FCR was observed in the fish grown under Aeromonas and control diets. The fish fed with control diet shows the FCR of 9.62, while the fish which are infected with A. hydrophila and fed with control diet exhibited the FCR of 11.55.
Furthermore, all the immunostimulant mixed feed significantly decreases the FCR when compared to the control groups. The FCR in the fish fed with selected immunostimulant feeds such as vitamin C, vitamin E, chitin, chitosan, and levamisole were found to be 7.25, 3.78, 8.78, 6.41, and 5.84 respectively. Whereas, FCR for the A. hydrophila infected fish fed with immunostimulant feeds such as vitamin C, vitamin E, chitin, chitosan, and levamisole were found to be 8.22, 11.53, 8.91, 7.89, and 6.92 respectively. According to these results, vitamin E has a lower FCR properties than the other immunostimulant feeds under normal conditions, whereas under Aeromonas exposure, levamisole shows lower FCR values. Furthermore, when compared to the Aeromonas infected fish with control diets, the fish fed with immunostimulant mixed feeds exhibited significantly decreased FCR values.
3.2 Morphometric and growth-related traits
The following morphometric characterisation of the fish in all of the treatment groups was assessed by measuring Body Length (BL), Body Width (BW), Body Depth (BD), Weight (W), Head Length (HL), Head Depth (HD), Eye Diameter (ED), Pupil Diameter (PD), Caudal Peduncle Length (CPL), Caudal Peduncle Width (CPW), Caudal Fin Length (CFL), Dorsal Fin Length (DFL), Pectoral Fin Length (PcFL), Pelvic Fin Length (PlFN), and Anal Fin Length (AFL).
3.2.1 Morphometric characterisation of healthy fish fed with different immunostimulants
Table 2, depicts the initial and final measurements of morphometric parameters of healthy fish fed with control and immunostimulant mixed feeds. Table 3 presents the net gain of morphometric parameters of healthy fish fed with control and immunostimulant mixed feeds. From these results, it was found that the morphometric parameters including body length, body width, and weight were significantly varied with different immunostimulant feeds. While, the parameters including HL, HD, ED, PD, CPL, CPW, CFL, DFL, PcFL, PlFL, and AFL have not exhibited significant variation with the different immunostimulant feeds.
.png) Table 2 Morphometric characteristics of healthy fish fed with control and immunostimulant mixed feed |
.png) Table 3 Net growth of morphometric parameters of healthy fish fed with control and immunostimulant mixed feed after 30 days of treatment |
Furthermore, fish fed with immunostimulant-supplemented diets showed greater body length increments than the fish fed with control feed. Among, all the tested feeds, fish fed with vitamin C mixed feed exhibited greater body length gain. After 30 days of treatment, the length gain of fish fed with control feed as well as vitamin C, vitamin E, Chitin, Chitosan, and levamisole supplemented feeds were found to be 1.4, 2.3, 2, 1.6, 1.9, and 1.8 cm respectively.
However, the fish fed with vitamin C and vitamin E supplemented feed exhibited greater body width (BW) than the control. Whereas, the fish fed with chitin, chitosan, and levamisole supplemented feed shows lesser BW than the control. The highest BW gain observed in the fish fed with vitamin E supplemented feed. After 30 days of treatment, the BW gain of fish fed with control feed as well as vitamin C, vitamin E, chitin, chitosan, and levamisole supplemented feeds were found to be 0.7, 1, 0.8, 0.5, 0.4 and 0.6 cm respectively (Figure 4 to Figure 9).
.jpg) Figure 4 Morphometric measurements of Catla catla fed with normal feed after 30 days of treatment |
.jpg) Figure 5 Morphometric measurements of Catla catla fed with vitamin C mixed feed after 30 days of treatment |
.jpg) Figure 6 Morphometric measurements of Catla catla fed with vitamin E mixed feed after 30 days of treatment |
.jpg) Figure 7 Morphometric measurements of Catla catla fed with Chitin mixed feed after 30 days of treatment |
.jpg) Figure 8 Morphometric measurements of Catla catla fed with Chitosan mixed feed after 30 days of treatment |
 Figure 9 Morphometric measurements of Catla catla fed with Levamisole mixed feed after 30 days of treatment |
3.2.2 Morphometric characterisation of Aeromonas hydrophila infected fish fed with different immunostimulants
The Table 4, depicts the initial and final measurements of morphometric parameters of Aeromonas infected fish fed with control and immunostimulant mixed feeds. The Table 5 illustrated the net gain of morphometric parameters of Aeromonas infected fish fed with control and immunostimulant mixed feeds. From these results, it was found that the morphometric parameters of infected fish including body length, body width, and weight were significantly varied with different immunostimulant feeds. While, there was no significant fluctuation observed in the metrics such as HL, HD, ED, PD, CPL, CPW, CFL, DFL, PcFL, PlFL, and AFL with the different immunostimulant diets.
.png) Table 4 Morphometric characteristics of Aeromonas hydrophila infected fish fed with control and immunostimulant mixed feed |
.png) Table 5 Net growth of morphometric parameters of Aeromonas hydrophila infected fish fed with control and immunostimulant mixed feed after 30 days of treatment |
Furthermore, infected fish fed with all five selected immunostimulant mixed feed exhibited lower lengths than the normal fish fed with immunostimulant diets. Among, all the tested feeds, Aeromonas infected fish fed with vitamin C mixed feed exhibited greater body length gain. After 30 days of treatment, the length gain of Aeromonas infected fish fed with control feed as well as vitamin C, vitamin E, chitin, Chitosan, and levamisole supplemented feeds were found to be 1.3, 1.8, 1.7, 1.3, 1.5, and 1.5 cm respectively.
However, the infected fish fed with vitamin C and vitamin E supplemented feed exhibited greater body width (BW) than the control. Whereas, the fish fed with chitosan supplemented feed shows lesser BW than the control. The BW gain of infected fish with the chitosan, and levamisole mixed feed are equal to the BW gain of fish fed with control feed. The highest BW gain observed in the infected fish fed with vitamin C supplemented feed. After 30 days of treatment, the BW gain of infected fish fed with control feed as well as vitamin C, vitamin E, chitin, Chitosan, and levamisole supplemented feeds were found to be 0.4, 1.2, 0.5, 0.4, 0.3, and 0.4 cm respectively (Figure 10 to Figure 15).
.jpg) Figure 10 Morphometric measurements of Aeromonas hydrophila infected Catla catla fed with control feed after 30 days of treatment |
 Figure 11 Morphometric measurements of Aeromonas hydrophila infected Catla catla fed with vitamin C mixed feed after 30 days of treatment |
 Figure 12 Morphometric measurements of Aeromonas hydrophila infected Catla catla fed with vitamin E mixed feed after 30 days of treatment |
 Figure 13 Morphometric measurements of Aeromonas hydrophila infected Catla catla fed with chitin mixed feed after 30 days of treatment |
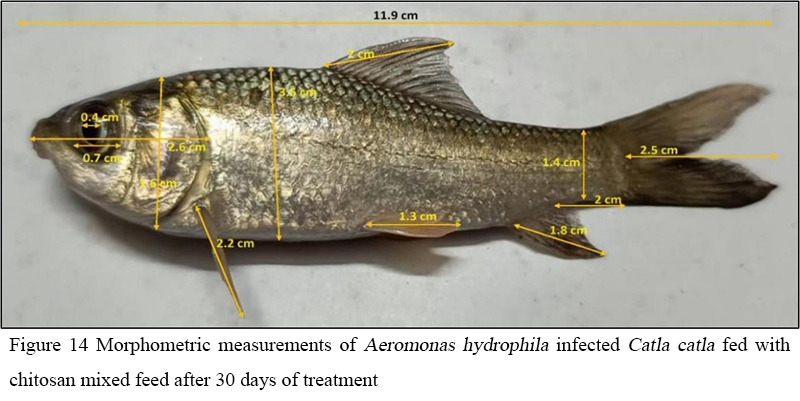 Figure 14 Morphometric measurements of Aeromonas hydrophila infected Catla catla fed with chitosan mixed feed after 30 days of treatment |
 Figure 15 Morphometric measurements of Aeromonas hydrophila infected Catla catla fed with levamisole mixed feed after 30 days of treatment |
From the Table 6 to Table 20 represents the comparative morphometric parameters of fish fed with control and the five immunostimulants mixed diets under healthy and Aeromonas infected conditions. One way ANOVA analysis and Tukey’s HSD analysis of morphometric parameters of fish fed with control and the five immunostimulants mixed diets under healthy and Aeromonas infected conditions.
.png) Table 6 Comparative morphometric parameters of fish fed with control and vitamin C mixed diets under normal and Aeromonas hydrophila infection |
.png) Table 7 One-way ANOVA analysis of morphometric parameters of fish fed with control and vitamin C mixed diets under normal and Aeromonas hydrophila infection SS - Sum of Squares, DF - Degrees of Freedom, MS - Mean Squares, F-value -- variation between mean values |
.png) Table 8 Tukey’s HSD analysis of morphometric parameters of fish fed with control and vitamin C mixed diets under healthy and Aeromonas hydrophila infection T1 – Healthy fish fed with control diet, T2 - Aeromonas infected fish fed with control diet, T3 – Healthy fish fed with Vitamin C mixed diet, T4 – Aeromonas infected fish fed with Vitamin C mixed diet, Q-value - studentized range statistic value, p <0.05 - Significant p-value* = Significant, p-value** = highly significant, p-value*** = extremely significant, p-valueNS = Not Significant |
.png) Table 9 Comparative morphometric parameters of fish fed with control and vitamin E mixed diets under normal and Aeromonas hydrophila infection |
.png) Table 10 One-way ANOVA analysis of morphometric parameters of fish fed with control and vitamin E mixed diets under normal and Aeromonas hydrophila infection SS - Sum of Squares, DF - Degrees of Freedom, MS - Mean Squares, F-value -- variation between mean values |
.png) Table 11 Tukey’s HSD analysis of morphometric parameters of fish fed with control and Vitamin E mixed diets under normal and Aeromonas hydrophila infection T1 – Healthy fish fed with control diet T2 - Aeromonas infected fish fed with control diet T3 – Healthy fish fed with Vitamin E mixed diet T4 – Aeromonas infected fish fed with Vitamin E mixed diet Q-value - studentized range statistic value, p <0.05 - Significant p-value* = Significant, p-value** = highly significant, p-value*** = extremely significant, p-valueNS = Not Significant |
.png) Table 12 Comparative morphometric parameters of fish fed with control and Chitin mixed diets under normal and Aeromonas hydrophila infection |
.png) Table 13 One-way ANOVA analysis of morphometric parameters of fish fed with control and Chitin mixed diets under normal and Aeromonas hydrophila infection SS - Sum of Squares, DF - Degrees of Freedom, MS - Mean Squares, F-value -- variation between mean values |
.png) Table 14 Tukey’s HSD analysis of morphometric parameters of fish fed with control and Chitin mixed diets under normal and Aeromonas hydrophila infection T1 – Healthy fish fed with control diet, T2 - Aeromonas infected fish fed with control diet, T3 – Healthy fish fed with Chitin mixed diet, T4 – Aeromonas infected fish fed with Chitin mixed diet, Q-value - studentized range statistic value, p <0.05 - Significant p-value* = Significant, p-value** = highly significant, p-value*** = extremely significant, p-valueNS = Not Significant |
.png) Table 15 Comparative morphometric parameters of fish fed with control and Chitosan mixed diets under normal and Aeromonas hydrophila infection |
.png) Table 16 One-way ANOVA analysis of morphometric parameters of fish fed with control and Chitosan mixed diets under normal and Aeromonas hydrophila infection SS - Sum of Squares, DF - Degrees of Freedom, MS - Mean Squares, F-value -- variation between mean values |
.png) Table 17 Tukey’s HSD analysis of morphometric parameters of fish fed with control and Chitosan mixed diets under normal and Aeromonas hydrophila infection T1 – Healthy fish fed with control diet T2 - Aeromonas infected fish fed with control diet T3 – Healthy fish fed with Chitosan mixed diet T4 – Aeromonas infected fish fed with Chitosan mixed diet Q-value - studentized range statistic value p <0.05 - Significant p-value* = Significant, p-value** = highly significant, p-value*** = extremely significant, p-valueNS = Not Significant |
.png) Table 18 Comparative morphometric parameters of fish fed with control and Levamisole mixed diets under normal and Aeromonas hydrophila infection |
.png) Table 19 One-way ANOVA analysis of morphometric parameters of fish fed with control and Levamisole mixed diets under normal and Aeromonas hydrophila infection SS - Sum of Squares, DF - Degrees of Freedom, MS - Mean Squares, F-value -- variation between mean values |
.png) Table 20 Tukey’s HSD analysis of morphometric parameters of fish fed with control and Levamisole mixed diets under normal and Aeromonas infection T1 – Healthy fish fed with control diet T2 - Aeromonas infected fish fed with control diet T3 – Healthy fish fed with Levamisole mixed diet T4 – Aeromonas infected fish fed with Levamisole mixed diet Q-value - studentized range statistic value p <0.05 - Significant p-value* = Significant, p-value** = highly significant, p-value*** = extremely significant, p-valueNS = Not Significant |
Though there is no significant change between the groups, finally the vitamin C and vitamin E have shown the improvement in growth performance and morphometric characteristics of the experimental fish.
3.3 Haemoglobin
The Table 21, shows the mean haemoglobin values of healthy and Aeromonas-infected Catla catla fish that were treated with different immunostimulant mixed feeds such as vitamin C, vitamin E, chitin, chitosan, and levamisole as well as the control feed. Based on these data, it was shown that the average haemoglobin values in all test groups varied significantly. The average haemoglobin values in healthy fish treated with different immunostimulant-supplemented feeds ranged from 6.86±0.37 to 14.61±0.35 gm/dL. In Aeromonas infected fish, haemoglobin levels with different immunostimulant mixed feeds typically vary from 5.99±0.66 to 13.04±0.19 gm/dL.
.png) Table 21 Haemoglobin content in the fish fed with different immunostimulant mixed feeds under normal and Aeromonas hydrophila infected conditions p-value* = Significant, p-value** = highly significant, p-value*** = extremely significant, p-valueNS = Not Significant |
The mean haemoglobin levels in healthy fish fed with immunostimulant mixed feed such as control, vitamin C, vitamin E, chitin, chitosan, and levamisole were found to be 6.86±0.37, 13.61±0.4, 14.61±0.35, 9.16±0.21, 9.79±0.49, and 12.65±0.22 gm/dL respectively. As well as, the mean haemoglobin levels in Aeromonas infected fish fed with immunostimulant mixed feed such as control, vitamin C, vitamin E, chitin, chitosan, and levamisole were found to be 5.99±0.66, 12.81±0.17, 13.04±0.19, 7.84±0.59, 8.83±0.33, and 11.77±0.26 g/dL respectively.
The quantity of haemoglobin significantly varies between healthy and Aeromonas infected fish from all the treatment groups. The p-values for the haemoglobin content of the healthy and Aeromonas infected fish in the treatment groups of control, vitamin C, vitamin E, chitin, chitosan, and levamisole were measured as 0.118, 0.023, 0.002, 0.022, 0.045, and 0.011 respectively. These results demonstrated that the tested immunostimulants significantly increased haemoglobin content in both healthy and Aeromonas infected fish when compared to the control.
3.4 Total RBC count
The mean total RBC count in the fish fed with different immunostimulant mixed feeds under normal and Aeromonas infected conditions is shown in Table 22. These results demonstrated significant variation in the mean values of the total RBC count across all test groups. The average total RBC count in healthy fish treated with different immunostimulant-supplemented feeds ranged from 1.24±0.08 to 2.85±2.09 ×10⁶/mm3. In Aeromonas infected fish, total RBC count with different immunostimulant mixed feeds typically varies from 1.16±0.05 to 2.25±0.08×10⁶/mm3.
 Table 22 Total RBC count in the fish fed with different immunostimulant mixed feeds under normal and Aeromonas hydrophila infected conditions p-value* = Significant, p-value** = highly significant, p-value*** = extremely significant, p-valueNS = Not Significant |
The mean total RBC count in healthy fish fed with immunostimulant mixed feed such as control, vitamin C, vitamin E, chitin, chitosan, and levamisole was found to be 1.24±0.08, 2.59±0.05, 2.85±0.09, 1.67±0.06, 1.77±0.06, and 2.21±0.03×10⁶/mm3 respectively. As well as, the mean total RBC count in Aeromonas infected fish fed with immunostimulant mixed feed such as control, vitamin C, vitamin E, chitin, chitosan, and levamisole was found to be 1.16±0.05, 2.05±0.07, 2.25±0.08, 1.26±0.05, 1.33±0.04, and 1.78±0.05×10⁶/mm3 respectively.
The total RBC count significantly varies between healthy and Aeromonas infected fish from all the treatment groups. The p - values for the total RBC count between healthy and Aeromonas infected fish in the treatment groups of control, vitamin C, vitamin E, chitin, chitosan, and levamisole were measured as 0.196, 0.0004, 0.001, 0.0006, 0.0005, and 0.0001 respectively. These results demonstrated that the tested immunostimulants significantly increased the total RBC count in both healthy and Aeromonas infected fish when compared to the control control-fed group.
3.5 Total WBC count
The mean total WBC count in the fish fed with different immunostimulant mixed feeds under normal and Aeromonas infected conditions is shown in Table 23. From these results, it was observed that the mean WBC count in all test groups varied significantly. The average total WBC count in healthy fish treated with different immunostimulant-supplemented feeds ranged from 4077±0.93 to 7535±1.07 cells/mm3. In Aeromonas infected fish, the total WBC count with different immunostimulant mixed feeds typically ranges from 4342±0.87 to 7757±1.06 cells/mm3.
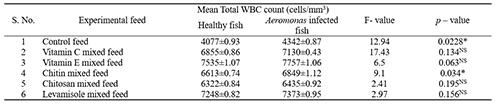 Table 23 Total WBC count in the fish fed with different immunostimulant mixed feeds under normal and Aeromonas hydrophila infected conditions p-value* = Significant, p-value** = highly significant, p-value*** = extremely significant, p-valueNS = Not Significant |
The mean total WBC count in healthy fish fed with immunostimulant mixed feed such as control, vitamin C, vitamin E, chitin, chitosan, and levamisole was found to be 4077±0.93, 6855±0.861, 7535±1.07, 6613±0.74, 6322±0.84, and 7248±0.82 cells/mm3 respectively. As well as, the mean total WBC count in Aeromonas infected fish fed with immunostimulant mixed feed such as control, vitamin C, vitamin E, chitin, chitosan, and levamisole were found to be 4342±0.87, 7130±0.43, 7757±1.06, 6849±1.12, 6435±0.92, and 7373±0.95 ×10³/mm3 respectively.
The total WBC count significantly varies between healthy and Aeromonas infected fish from all the treatment groups. The p - values for the total WBC count content between healthy and Aeromonas infected fish in the treatment groups of control, vitamin C, vitamin E, chitin, chitosan, and levamisole were measured as 0.0228, 0.134, 0.063, 0.034, 0.195, and 0.156 respectively. These results demonstrated that the chitin mixed feed significantly increased the total WBC count content in both healthy and Aeromonas infected fish when compared to the control control-fed group.
3.6 Differential leucocyte count
Differential blood counts of the fish fed with different immunostimulant mixed feeds under normal and Aeromonas infected conditions were performed by counting the blood cells including eosinophils, basophils, neutrophils, lymphocytes, and monocytes.
3.6.1 Eosinophils
The Table 24 shows the mean eosinophil count of healthy and Aeromonas infected Catla catla fish that were treated with different immunostimulant mixed feeds. According to these results, it was observed that the average eosinophil count in all test groups varied significantly. The average eosinophil count in healthy fish treated with different immunostimulant-supplemented feeds ranged from 357±53.07 to 475±45.76 cells/mm3. In Aeromonas infected fish, eosinophil count with different immunostimulant mixed feeds typically ranges from 369±50.21 to 543.66±52.51 cells/mm3.
 Table 24 Eosinophil count in the fish fed with different immunostimulant mixed feeds under normal and Aeromonas hydrophila infected conditions p-value* = Significant, p-value** = highly significant, p-value*** = extremely significant, p-valueNS = Not Significant |
The mean eosinophil count in healthy fish fed with immunostimulant mixed feeds such as control, vitamin C, vitamin E, chitin, chitosan, and levamisole was found to be 475±45.76, 412±49.31, 357±53.07, 417±53.02, 430±47.12, and 358±41.06 cells/mm3 respectively. As well as, the mean eosinophil count in Aeromonas infected fish fed with immunostimulant mixed feed such as control, vitamin C, vitamin E, chitin, chitosan, and levamisole was found to be 543.66±52.51, 408±44.65, 369±50.21, 454±52.003, 466±46.36, and 393±67.002 cells/mm3 respectively. The number of eosinophils significantly varies between healthy and Aeromonas infected fish from all the treatment groups.
The p - values for the eosinophil count healthy and Aeromonas infected fish in the treatment groups of control, vitamin C, vitamin E, chitin, chitosan, and levamisole were measured as 0.166, 0.925, 0.779, 0.421, 0.394, and 0.47 respectively. These results demonstrated that the tested immunostimulants decreased eosinophil count but not significantly in both healthy and Aeromonas infected fish when compared to the control control-fed group.
3.6.2 Basophils
The basophil counts in the fish fed with different immunostimulant mixed feeds under normal and Aeromonas infected conditions are shown in Table 25. Based on these findings, it was determined that there was no statistically significant variation in the average basophil counts across the groups being tested. The average basophil counts in healthy fish treated with different immunostimulants mixed feed ranged from 38±9 to 48±9 cells/mm3. In Aeromonas infected fish, basophil counts with different immunostimulant mixed feeds typically ranged from 34±6.5 to 42.6±6.02 cells/mm3.
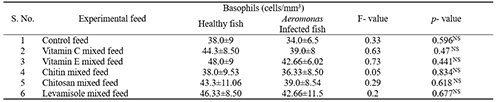 Table 25 Basophils count in the fish fed with different immunostimulant mixed feeds under normal and Aeromonas hydrophila infected conditions p-value* = Significant, p-value** = highly significant, p-value*** = extremely significant, p-valueNS = Not Significant |
The mean basophil counts in healthy fish fed with immunostimulant mixed feed such as control, vitamin C, vitamin E, chitin, chitosan, and levamisole was found to be 38±9, 44.3±8.50, 48±9, 38±9.53, 43.3±11.06, and 46.33±8.50 cells/mm3 respectively. As well as, the mean basophil counts in Aeromonas infected fish fed with immunostimulant mixed feed such as control, vitamin C, vitamin E, chitin, chitosan, and levamisole was found to be 34±6.5, 39±8, 42.66±6.02, 36.33±8.50, 39±8.54, and 42.66±11.5 cells/mm3 respectively.
The number of basophils insignificantly varies between healthy and Aeromonas infected fish from all the treatment groups. The p - values for the basophil counts between healthy and Aeromonas infected fish in the treatment groups of control, vitamin C, vitamin E, chitin, chitosan, and levamisole were measured as 0.596, 0.471, 0.441, 0.834, 0.618, and 0.677 respectively. These results demonstrated that the tested immunostimulants don’t exhibit a significant impact on the basophil count in both healthy and Aeromonas infected fish when compared to the control control-fed group.
3.6.3 Neutrophils
The Table 26 shows the mean neutrophil counts of healthy and Aeromonas infected Catla catla fish that were fed with different immunostimulant-supplemented feeds. From these results, it was shown that the average neutrophils count in all test groups varied significantly. The mean neutrophil counts in healthy fish treated with different immunostimulants mixed feed ranged from 2650±0.525 to 3340±0.49 cells/mm3. Whereas, in Aeromonas infected fish, neutrophil counts with different immunostimulant mixed feeds ranged between 5060±0.89 and 7570±0.62 cells/mm3.
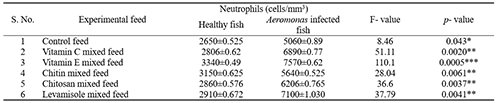 Table 26 Neutrophil counts in the fish fed with different immunostimulant mixed feeds under normal and Aeromonas hydrophila infected conditions. p-value* = Significant, p-value** = highly significant, p-value*** = extremely significant, p-valueNS = Not Significant |
The mean neutrophil counts in healthy fish fed with immunostimulant mixed feed such as control, vitamin C, vitamin E, chitin, chitosan, and levamisole were found to be 2650±0.525, 2806±0.62, 3340±0.49, 3150±0.625, 2860±0.576, and 2910±0.672 cells/mm3 respectively. As well as, the mean neutrophil number in Aeromonas infected fish fed with immunostimulant mixed feed such as control, vitamin C, vitamin E, chitin, chitosan, and levamisole were found to be 5060±0.89, 6890±0.77, 7570±0.62, 5640±0.525, 6206±0.765, and 7100±1.030 cells/mm3 respectively.
The number of neutrophils significantly varies between healthy and Aeromonas infected fish from all the treatment groups. The p - values of the neutrophil counts between healthy and Aeromonas infected fish in the treatment groups of control, vitamin C, vitamin E, chitin, chitosan, and levamisole were measured as 0.043, 0.0020, 0.00046, 0.0061, 0.0037, and 0.0041 respectively. These results demonstrated that the tested immunostimulants significantly increased the neutrophils content in both healthy and Aeromonas infected fish when compared to the control.
3.6.4 Lymphocytes
The Table 27, presents the mean lymphocyte counts of healthy and Aeromonas-infected Catla catla fish that were given various immunostimulant-mixed feeds, along with a control feed. Based on these findings, it was noted that the average lymphocyte counts in all the test groups, with the exception of the chitosan mixed diet group, showed significant variation. The mean lymphocyte counts in healthy fish that treated with different immunostimulant mixed feeds ranged from 2531±0.79 to 3072±0.99 cells/mm3. Whereas, in Aeromonas-infected fish, the lymphocyte counts varied between 2290±1.095 and 2740±1.270 cells/mm3 with the use of different immunostimulant mixed feeds.
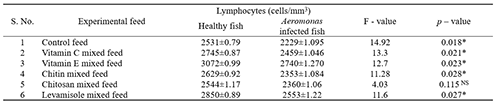 Table 27 Lymphocyte counts in the fish fed with different immunostimulant mixed feeds under normal and Aeromonas hydrophila infected conditions p-value* = Significant, p-value** = highly significant, p-value*** = extremely significant, p-valueNS = Not Significant |
The average lymphocyte counts in healthy fish that were fed with different types of immunostimulant mixed feeds including control, vitamin C, vitamin E, chitin, chitosan, and levamisole, were measured to be 2531±0.79, 2531±0.79, 3072±0.99, 2629±0.92, 2544±1.17, and 2850±0.89 cells/mm3 respectively. As well as, the mean counts of lymphocytes in Aeromonas infected fish that were fed with different types of immunostimulant mixed feeds including control, vitamin C, vitamin E, chitin, chitosan, and levamisole were reported to be 2229±1.095, 2459±1.046, 2740±1.270, 2353±1.084, 2360±1.06, and 2553±1.22 cells/mm3 respectively.
The number of lymphocytes shows considerable variation between healthy fish and those infected with Aeromonas across all treatment groups. The p - values for the lymphocyte counts between healthy and Aeromonas infected fish in the treatment groups of control, vitamin C, vitamin E, chitin, chitosan, and levamisole were 0.018, 0.021, 0.023, 0.028, 0.115, and 0.027 respectively. These results indicated that the tested immunostimulants had a substantial effect on increasing significantly the number of lymphocytes in both healthy and Aeromonas infected fish when compared to the control control-fed group.
3.6.5 Monocytes
The average monocyte counts of healthy and Aeromonas infected Catla catla fish treated with various immunostimulant mixed diets are shown in Table 28. According to these data, it was demonstrated that the average monocyte count differed considerably across all test groups. The mean monocyte counts in healthy fish treated with various immunostimulant mixed feeds ranged from 178±0.64 to 370±0.51 cells/mm3. Whereas, in Aeromonas-infected fish, the monocyte counts varied between 462±0.56 and 685±0.77 cells/mm3 with the use of different immunostimulant mixed feeds.
 Table 28 Monocyte counts in the fish fed with different immunostimulant mixed feeds under normal and Aeromonas hydrophila infected conditions p-value* = Significant, p-value** = highly significant, p-value*** = extremely significant, p-valueNS = Not Significant |
The mean monocyte counts in healthy fish fed with immunostimulant mixed feed such as control, vitamin C, vitamin E, chitin, chitosan, and levamisole were found to be 178±0.64, 287±0.62, 370±0.51, 247±0.4007, 261±0.45, and 274±0.66 cells/mm3 respectively. As well as, the mean monocyte counts in Aeromonas infected fish fed with immunostimulant mixed feed such as control, vitamin C, vitamin E, chitin, chitosan, and levamisole were found to be 462±0.56, 654±0.61, 685±0.77, 547±0.625, 556±0.62, and 492±0.72 cells/mm3 respectively.
The monocyte counts show significant variation between healthy fish and those infected with Aeromonas across all treatment groups. The p - values for the monocyte counts between healthy and Aeromonas infected fish were examined in the following treatment groups: control, vitamin C, vitamin E, chitin, chitosan, and levamisole. The p - values for these groups were 0.0046, 0.0019, 0.0041, 0.0022, 0.0030, and 0.018, respectively. These results indicate that the tested immunostimulants significantly enhance the monocyte count in both healthy and Aeromonas infected fish, as compared to the control feed.
3.7 Erythrocyte sedimentation rate (ESR)
The Table 29 shows the mean ESR values of healthy and Aeromonas infected Catla catla fish which were treated with different immunostimulant-supplemented feeds. From these results, it was observed that there was no statistically significant variation in the average ESR across the groups being tested. The mean ESR values in healthy fish treated with different immunostimulant mixed feeds ranged from 0.27±0.13to 0.39±0.17 cm/hour. Whereas, in Aeromonas infected fish, the ESR with different immunostimulant mixed feeds vary between 0.33±0.111 and 0.45±0.14 cm/hour.
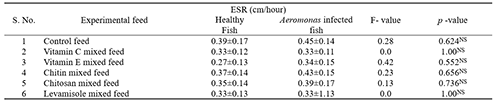 Table 29 ESR in the fish fed with different immunostimulant mixed feeds under normal and Aeromonas hydrophila infected conditions p-value* = Significant, p-value** = highly significant, p-value*** = extremely significant, p-valueNS = Not Significant |
The mean ESR values in healthy fish fed with immunostimulant mixed feed such as control, vitamin C, vitamin E, chitin, chitosan, and levamisole were found to be 0.39±0.17, 0.33±0.12, 0.27±0.13, 0.37±0.14, 0.35±0.14, and 0.33±0.13 cm/hour respectively. As well as, the mean ESR in Aeromonas infected fish fed with immunostimulant mixed feeds such as control, vitamin C, vitamin E, chitin, chitosan, and levamisole were found to be 0.45±0.14, 0.33±0.11, 0.34±0.15, 0.43±0.15, 0.39±0.17, and 0.33±1.13 cm/hour respectively.
In this study, the ESR insignificantly varies between healthy and Aeromonas infected fish from all the treatment groups. The p - values for the ESR between healthy and Aeromonas infected fish in the treatment groups of control, vitamin C, vitamin E, chitin, chitosan, and levamisole were measured as 0.624, 1.00, 0.552, 0.656, 0.736, and 1.00 respectively. These results demonstrated that the tested immunostimulants insignificantly increased the ESR in both healthy and Aeromonas infected fish when compared to the control control-fed group.
4 Discussion
Aquaculture offers a sustainable source of cost-effective and nutritious protein for humans to consume, thus enhancing human health. Regrettably, the occurrence of epidemics of diseases remains a substantial hindrance to the attainment of profitable production through technological improvement. Researchers in the aquaculture field are currently studying a number of biologically safe and environmentally acceptable substances that have the potential to regulate the immune system, enhance growth performance, and prevent diseases in fish (Mansour et al., 2021).
In addition, they serve the purpose of safeguarding aquaculture organisms against many environmental factors such as water pollution, low temperatures, and excessive population density (Refaey et al., 2022). Immunostimulants positively affect growth rate efficiency and enhance the sustainability of aquaculture (Yossa et al., 2018). Immunostimulants have significant value in maintaining fish diseases and can be beneficial in fish farming. Studies have demonstrated the immunostimulatory properties of glucan, chitin, lactoferrin, and levamisole in fish and crustaceans. Vitamin B and C, growth hormone, and prolactin are also known to have immunostimulatory effects.
Immunostimulants enhance the activity of natural killer cells, complement, lysozyme, and antibody reactions in fish. The stimulation of these immune activities is linked to the enhanced defence against infectious pathogens (Sakai, 1999). Hence, the present research aims to assess the potential impacts of different immunostimulants on the growth performance and morphometric parameters of the Catla catla. The growth performance of the fish in all groups of treatment was evaluated by measuring the total biomass gain (TBG), weight gain (WG), and feed conversion ratio (FCR).
The findings of this study showed that the inclusion of immunostimulant mixed feed resulted in a significant increase in overall biomass gain compared to control. Based on these findings, vitamin E has superior growth-promoting characteristics compared to the other immunostimulant diets. The research conducted by Aathi et al. (2013), supports the argument that adding chitosan mixed fish feed can enhance the proximate value of crude protein in Indian large carp, Labeo rohita. The observed outcomes can be attributed to the augmentation of digestive enzymes, which aid in enhancing nutrition and facilitating the absorption of nutrients in the intestines. Consequently, this leads to a rise in fish growth (Abdel-Tawwab et al., 2020).
The present study revealed a significant rise in the weight gain of fish that were fed with immunostimulant diet compared to the control group after a period of 30 days. The FCR (Feed Conversion Ratio) of all the groups that received treatment was greater than that of the control group. These results were in accordance with the observations made by Abdelkhalek et al. (2008) and Awad et al. (2013) who found that nourishing sea bream with Nigella sativa, or synthetic immunostimulants, over a period of 30 to 60 days led to a substantial rise in weight gain and the rate of survival.
The findings of this study correlate with the research conducted by Rozi et al. (2018) who showed that including chitosan in the diet resulted in a significant rise of 12.19±3.45 g in the relative weight growth of Oreochromis niloticus. In another study, Sarker et al. (2023) found that the average weight gain of fish at the end of the experiment was 6.88±0.046, 8.97±0.042, 5.94±0.036, and 4.65±0.051 in the treatment groups T1, T2, T3, and the control group respectively. Payung et al. (2017) reported that the addition of ginger to diets at concentrations ranging from 1.0 to 8.5 g/kg resulted in growth promoting benefits in catla, nile tilapia, and rohu accordingly. Similarly, Talpur et al. (2013) observed a notable increase in rate of development when rainbow trout were fed with ginger containing feed.
Setijaningsih et al. (2021) examined the impact of various immunostimulants on the growth rate of Oreochromis niloticus, and they found that treatment B resulted in the greatest size increase, with an increase in weight of 17.75±0.48 g, followed by treatment C with a weight gain of 15.91±0.71 g, treatment D with a weight gain of 11.92±0.21 g, and treatment A with a weight gain of 11.97±0.42 g accordingly. Purbomartono et al. (2021) found that the weight gain of African catfish nourished with a diet containing 7.5 g/kg of ginger (T3) and diets containing 25, 50, and 75 g/kg of turmeric were significantly different from the weight gain of fish nourished with the control diet. The magnitude of weight gain is greater than the magnitude of length increase. The inherent biology of the fish is one of the sources of this condition. Positive allometry refers to a growth pattern in which the rate of weight increase is greater than the rate of length increase (Dewi et al., 2017).
The feed conversion ratio (FCR) represents the proportion of feed required to generate 1 kg of cultured fish flesh. A lower feed conversion ratio indicates a more efficient transformation of feed into meat, whereas a higher ratio suggests a less efficient conversion. The current findings indicate that there is substantial variation in the feed conversion ratio across various immunostimulant diets in Catla catla fish. The feed conversion ratio is commonly employed to assess the quality of the feed provided for fish development (Saputra et al., 2018). According to Defrizal and Khalil (2015) the FCR variability is affected by factors such as feed quality, feed quantity, species type, and fish size. Mudjiman (2011) stated that the FCR in fish typically ranges between 1.5 and 8. According to this statement, it can be concluded that the FCR of most treatments in the current study is favourable as it is within an acceptable range.
Furthermore, the present findings are consistent with the results reported by Khattabya et al. (2004) who showed that the Biogen® diet led to an enhancement of consumption of feed, FCR, protein efficiency ratio, and other metabolic parameters such as crude protein, solvent extract, ash, and moisture in fish. Novian et al. (2023) reported that following a treatment period of 42 days, the feed conversion ratio ranged from 1.6 to 2.3. The treatment with the highest FCR value is A, whereas the treatment with the lowest FCR value is C. The symbiotic supplementation of 2.5 g/kg and 5 g/kg resulted in a ratio of 2.3±0.3. Udo et al. (2018) stated that the inclusion of chitosan in the Clarias gariepinus meal at the ideal dosage can enhance the survival rate of fish. The study conducted by Sarker et al. (2023) observed that the average FCR of fish treatments T1, T2, T3, and the control were 1.35±0.009, 1.10±0.029, 1.56±0.010, and 1.56±0.022 respectively. In another study, Hassan et al. (2018) found that the FCR was considerably improved in the treatment groups supplemented with turmeric, rosemary, and thyme compared to the control group. Purbomartono et al. (2021) found that the FCR of African catfish fed with ginger and turmeric diets was significantly different from the control group.
In addition, the FCR of the turmeric diet and the ginger diet at a dosage of 75 g/kg exhibited the most optimal results. The results of this study showed that these treatments influenced haematological responses associated with immune status in Catla catla, thereby effectively enhancing metrics related to growth promotion. The fish fed with vitamin E mixed feed had the most favourable outcomes, as evident by notable enhancements in the final body weight, weight gain percentage, and FCR, in comparison to the fish that were fed with a control diet.
In the present study, it was found that a 30-day dietary supplementation of immunostimulants substantially influences the body length, feed intake, feed conversion, and biomass in Catla catla. Vitamins are vital chemical substances that play a crucial role in sustaining life, as they are necessary in small quantities for regular growth, reproduction, and overall health (Gouda et al., 2020). L-ascorbic acid phosphate is a stable variant of vitamin C that can be used in feed as a supplement and it plays several important functions including immunostimulant and free radical scavenger.
Multiple research studies such as Abdel Rahman et al. (2020) and Liua et al. (2018) have found that adding vitamin C to fish feed can improve both developmental and immunological responses. Ibrahim et al. (2020) found that the final body weight, total weight gain, daily weight gain, and specific growth rate in Nile tilapia showed an exponential rise in the three experimental groups that received vitamin C supplementation when compared with the control group that did not receive vitamin C supplementation. However, the differences in feed intake, FCR, and PER across the experimental groups were not statistically significant.
Similarly, Xu et al. (2022) found that maintaining an appropriate quantity of vitamin C in the diet significantly enhanced the growth performance of Coho salmon post-smolts. But the amounts of dietary vitamin C didn’t have any major effect on the ability to survive Coho salmon post-smolts. In addition, the specific growth rate of fish enhanced but the FCR dropped when they were fed with varying concentrations of vitamin C supplemented diets. The variables HIS, VSI, and CF did not have any substantial impact when exposed to varying doses of vitamin C. Padua et al. (2015) demonstrated that feeding O. niloticus with Aqute FishTM® supplemented diets had a greater survival rate; however, there was no difference in weight gain or specific growth rate. In contrast to the current findings, previous research conducted by Simic and Karel (1980) and Gao et al. (2012) found that the consumption of dietary vitamin C led to a reduction in feed intake and slower growth in fish. This was attributed to the alteration of the diet flavour and odour resulting from the deterioration of dietary lipids.
The vitamin C requirements of fish are influenced by several factors such as age, size, species, and conditions of rearing (Dawood and Koshio, 2016). Research on the vitamin C supplemented feed specifications for several fish species indicates that fish require 20~50 mg/kg of feed to meet their demands (NRC, 2011). In the current study, the addition of vitamin C to the diet of Catla catla resulted in a considerable enhancement in their growth performance compared to the control group. This may be caused by the vitamin C induced overexpression of growth hormone levels, improved intestinal health, and improved fish gut absorptive surface (Abdel Rahman et al., 2018). Faramarzi (2012) stated that the greater rate of development and weight gain seen in Nile tilapia when given vitamin C supplements can be attributed to the acceleration of protein synthesis.
Vitamin E refers to a group of eight naturally occurring lipophilic substances. The most biologically active form of vitamin E is α-tocopherol, which has an important role in normal metabolic functioning and biological processes (Combs and McClung, 2017). Fish are unable to produce all the biologically functional kinds of vitamin E on their own and therefore need external sources in their diet to obtain it (Peng and Gatlin, 2009). Inadequate diets that lack vitamin E can result in stunted growth, poor production of RBC, muscular weakness, darker skin, exudative diathesis, skin depigmentation, liver fat deterioration, and mortality (NRC, 2011).
Multiple research studies including Lu et al. (2016) and Bae et al. (2013) have documented that the application of dietary vitamin E supplementation improves the growth performance of fish. The present study demonstrates that the addition of vitamin E to the diet for a period of 30 days leads to a substantial enhancement in body growth and biomass. The results of this study agree with the findings of Taveekijakarn et al. (1996) who observed that a certain dosage of vitamin E stimulated the growth of aquatic animals. Similarly, He et al. (2017) found that catfish fed with a vitamin E supplemented diet significantly increased growth parameters such as mean weight gain, daily mean growth, and PER compared to those fed with the control diet. Furthermore, the greatest results were observed in fish receiving a diet supplemented with 100 mg/kg of vitamin E.
Saheli et al. (2021) reported that raising the dietary vitamin E concentration had a significant positive effect on the weight gain rate, specific growth rate, and protein efficacy ratio in Caspian trout. The greatest values were observed in Caspian trout fed with a diet supplemented with 78.8 mg/kg of vitamin E. In contrast, the FCR showed a linear and exponential reduction as the vitamin E concentration increased. The lowest FCR value was observed in fish that were fed a diet supplemented with 78.8 mg/kg of vitamin E. Rohani et al. (2023) found that adding vitamin E to the fish diet significantly increased their growth indices including weight gain and specific growth rate, when compared to fish fed with a control diet. In the same manner, feed utilisation markers such as FCR and PER were considerably increased without any noticeable differences in the control group.
James et al. (2008) reported that vitamin E has a considerable impact on the eating, growth, reproduction, and leukocyte count of C. auratus. Furthermore, they noted that fish fed a diet containing 300 mg of vitamin E per kg exhibited superior growth, gonad weight, gonadosomatic index, egg production, egg size, and hatching rate. Mehrad et al. (2012) found a notable disparity in body weight increase among zebrafish that were fed with a supplemental diet containing 500 and 1000 mg/kg of vitamin E, in comparison with the other groups. Additionally, the fish that were fed with a diet containing 1000 mg/kg of vitamin E exhibited the highest BWG. According to Wassef et al. (2001) the inclusion of vitamin E in the diet of aquatic organisms inhibits the oxidative degradation of unsaturated fatty acids in their diets and tissues. This assists in maintaining a typical metabolism and leads to increased survival rate, weight gain, and feed efficiency in these animals. Furthermore, He et al. (2017) found that vitamin E had a substantial impact on the development of the gut in fish. It was achieved by strengthening the structure of the intestinal wrinkles and increasing the thickness of the mucosal membrane. Since, the digestive and absorptive abilities of fish were enhanced, leading to improved growth. The findings of this study demonstrate that incorporating vitamin E into the diet is crucial for enhancing the survival rate and promoting the growth of Catla catla.
Chitin is the second most commonly found polysaccharide, following cellulose, and it makes up a significant portion of the exoskeleton structure of crustaceans (Boric et al., 2020). Chitin and its derived compounds possess several applications attributed to their biocompatibility (Barikani et al., 2014), biodegradability (Zhu et al., 2019), antibacterial and antioxidative characteristics (Ahmad et al., 2020). Danulat (1987) reported that the gastrointestinal system of Gadus morhua can digest up to 90% of chitin. Additionally, it has chitinase activity throughout its gastrointestinal system. In addition, Fines and Holt (2010) discovered that young Rachycentron canadum possess chitinolytic activity in their gastrointestinal system.
In this study, the addition of chitin to the diet over a period of 30 days leads to an increase in overall body weight. These outcomes are clearly evident as Kono et al. (1987) found that adding chitin to the diet of different kinds of fish such as yellowtail, sea bream, and Japanese eel, resulted in an increased growth rate and improved feed effectiveness. Shiau and Yu (1999) reported that the growth performance and digestibility of diet ingredients in hybrid tilapia fingerlings decrease as the amount of additional chitin in their diet increases. Elserafy et al. (2021) observed that the addition of chitin to the base diet of Nile tilapia at concentrations of 2 and 5% did not exhibit a significant improvement in growth performance when compared to the control group.
Chitosan is a biopolymer composed of glucosamine and N-acetylglucosamine that is obtained from the chitin found in the exoskeletons of crustaceans like crabs, lobsters, prawns, and krill, as well as the cell walls of fungi (El-Naggar et al., 2021). The addition of chitosan has a beneficial impact on the growth of fish, and additionally, on the structure and function of the intestines and the process of nutrient digestion and absorption. Abdel-Ghany and Salem (2019) and Maqsood et al. (2010) found that adding 2% chitosan to the diet of common carp can decrease fish mortality and improve their ability to grow.
Similarly, Salam et al. (2021) found that the chitosan supplemented feed at a dose of 1 g/kg increased body weight gain at days 15, 30, 45, and 60 after the treatment in juvenile Barbonymus gonionotus. Zaki et al. (2015) observed that the mean percentage of feed body weight and specific growth rate per day were significantly greater in the three groups of Dicentrarchus labrax that received a diet supplemented with 1 g chitosan per kg diet. The findings of Zhao et al. (2022) have substantiated that chitosan has the ability to inhibit the digestion of Dp-Ca (peptide-calcium chelate) in the stomach. This, in turn, leads to an increased amount of calcium being introduced into the intestine, thereby facilitating the absorption of calcium.
Levamisole, a synthetic compound belonging to the phenylimidazolthiazole class, is currently widely employed in human as well as animal medicine as an antihelminthic drug (Janssen, 1976). Levamisole was originally used in fish to augment the innate immune response (Baba et al., 1993) and used as an adjuvant in combination with a vaccine (Jeney and Anderson, 1993). Maqsood et al. (2009) found that adding 250 mg of levamisole per kg of feed considerably improved the specific growth rate of Cyprinus caprio compared to fish that were fed a control diet. They also observed that the levamisole supplementation enhanced the FCR.
Siwicki and Korwin-Kossakowski (1988) demonstrated that levamisole enhances the growth of Cyprinus caprio larvae while having no impact on their survival or developmental pace. Mulero et al. 91988) found that Sparus aurata fish that received levamisole exhibited greater size and weight at the end of the trail when compared to the control group. Alvarez Pellitero et al. (2006) reported that Scophthalmus maximus treated with the 500 mg/kg supplemented levamisole diet exhibited a greater specific growth rate compared to the control group. Similarly, Niki et al. (1991) demonstrated that levamisole has a substantial impact on the specific growth rate of fish, resulting in a significant rise when compared with the control group. Bhatnagar and Lamba (2016) reported a statistically significant increase in the growth and feed efficiency of C. mrigala after 60 days of ingesting a diet with varying concentrations of levamisole. The results of this study indicate that adding levamisole to the diet of Catla catla significantly improves their innate immune response, boosts their resistance to disease, reduces mortality, and promotes fish growth.
Haematology is the branch of science that focuses on the examination of the fundamental elements including blood cells, and the identification of anomalies in the normal functioning of these cells. Pathology intricately connects with haematology to assess the physical condition of fish, determining whether they are in a state of health or disease. The composition of the blood will undergo alterations, particularly if it becomes contaminated. Alterations in the fish’s physiology are indicated by variations in the blood composition, including measurements of haematocrit levels, haemoglobin levels, and blood cell counts.
Esepelid et al. (1987) assert that alterations in the blood composition of fish can serve as reliable markers for both infection and stress-related circumstances. Hence, blood measures play a vital role in assessing the nutritional adequacy, level of substances, and potential harm to the circulatory system in aquatic animals (Dash et al., 2015). Immunostimulants are critical in enhancing aquatic organisms’ growth productivity by increasing their ability for feed digestion, utilisation, and haematological, as well as Immunological responses (Ringo et al., 2012).
Therefore, the objective of this study was to investigate the impact of several immunostimulants on the haematological parameters of Catla catla in both normal and Aeromonas infected conditions. The blood parameters were measured by assessing the concentration of haemoglobin, total RBC count, total WBC count, differential count, and erythrocyte sedimentation ratio. Ramesh et al. (2015) found that the haematological parameters were enhanced during the experiment due to the influence of feed additives.
Haemoglobin consists of polypeptide chains, referred to as globins, each of which contains a prosthetic group called heme. Globins are present in all organisms and tissues, displaying a wide range of quaternary structures and multiple functions in addition to transporting and storing oxygen, as demonstrated by cytoglobins and neuroglobins (Fago et al., 2004). Haemoglobin, found in red blood cells, enable the solubility of large amounts of gas and carry it to the tissues. Within the tissues, oxygen acts as the final recipient of electrons produced by oxidative catabolic reactions (Giardina et al., 2004).
Haemoglobin primarily serves the purpose of transporting oxygen from the gas-exchange organs to the peripheral tissues. Depending on the partial pressure of the gas, it must have the capacity to both firmly bind oxygen and release it when needed (Perutz, 1978). Riggs (1976) observed that haemoglobin appears to adapt to the diverse metabolic requirements of animals and the consistent fluctuations in their environment. According to Landini et al. (2002) haemoglobin play a crucial role in fish adaptation by serving as a connection between the organism and its surroundings. Fish, in comparison to terrestrial species, encounter a highly fluctuating environment with frequent changes in oxygen levels, both in terms of time and space.
Multiple studies have documented alterations in haemoglobin levels in fish in response to varying environmental conditions. For instance, Bastiawan et al. (1995) documented that stress in fish resulted in alterations in various blood parameters such as haemoglobin, hematocrit, RBC and WBC count. There is a noticeable rise in haemoglobin and hematocrit levels in Nile tilapia, O. niloticus, when they are fed with Bacillus amyloliquefaciens supplemented feed (Reda and Selim, 2015). Similarly, Kumar et al. (2008) reported an increase in WBC count in Labeo rohita when fed with Bacillus subtilis supplemented diets.
In the present study, the mean haemoglobin concentration in healthy fish fed with various immunostimulant supplemented diets varied between 6.86±0.37 and 14.61±0.35 gm/dL. The haemoglobin concentrations in fish infected with Aeromonas and fed with different immunostimulant mixed feeds ranged from 5.99±0.66 to 13.04±0.19 gm/dL. These results demonstrated that the fish fed with immunostimulant mixed feed exhibited significantly greater haemoglobin content in both healthy and Aeromonas infected fish when compared to fish fed with control feed.
Furthermore, the vitamin E mixed feeds induce greater haemoglobin content in both normal and Aeromonas infected conditions than the other immunostimulants. The current results are consistent with the findings of Wu et al. (2013) who reported that the haemoglobin percentage was elevated (p >0.05) in the C0.5 group on days 28 and 42 and in the C1.0 group on days 14, 28, and 42 when compared to the control with the treatment of Coriolus versicolor polysaccharides in all gynogenetic crucian carp.
The present study found that healthy fish treated with immunostimulant mixed feeds had an average total RBC count ranging from 1.24±0.08 to 2.85±2.09 ×10⁶/mm3. Aeromonas infected fish had a total RBC count ranging from 1.16±0.05 to 2.25±0.08 ×10⁶/mm3 when fed immunostimulant mixed diets. The current findings showed that fish fed with immunostimulant mixed feed had considerably higher RBC counts in both healthy and Aeromonas infected fish as compared to fish given control feed.
Furthermore, vitamin E mixed feed significantly enhances the RBC count in both normal and Aeromonas infected fish. Ahmad (1982) reported that the reference fish had a mean RBC count of 2.2 ×10⁶ cells/mm3 of blood. The current findings are consistent with those of Zhou et al. (2012) who found a considerably greater RBC number in Rachycentron canadum fed with vitamin-C supplemented feed. Similarly, Burrells et al. (2001) found enhanced RBC number in Atlantic salmon fed with a nucleotide supplemented diet; however, the difference was not statistically significant. These findings suggest that the ingredients of the experimental feed might have an influence on haematocrit levels.
In accordance with the present study, Rairakhwada et al. (2007) found that channel catfish fed with β-1,3/1,6 glucan had a higher RBC count. Muahiddah and Diamahesa (2023) found that prechallenged Cyprinus carpio had a maximum RBC count of 2.63±0.034 ×10⁶ cells/mm3 when treated with 25 g of Euphorbia hirta leaf extract per Kg. Following infection with the pathogen, a maximal RBC count of 1.93±0.012 ×10⁶ cells/mm3 was observed on the 5th day with 25 g of E. hirta leaf extract per Kg and 50, 20, 10, and 5 g leaf extracts.
In contrast to the current findings, Kumar et al. (2006) discovered that supplanting with dietary starch fails to improve RBC count or haemoglobin concentration. Furthermore, Aeromonas infected fish had significantly fewer RBC than control fish. Pulungan et al. (2022) stated that hemolysin produced by the A. hydrophila bacterium can cause red blood cell lysis.
The total white blood cell count provides insight into the immunological condition of the fish, as WBC are the primary constituents of the immune system. Leukocytes, often known as blood cells, are responsible for targeting and destroying infections by engulfing them through a process called phagocytosis. The application of immunostimulants in the diet resulted in a rise in the total number of leukocytes, indicting an enhancement of cellular defence mechanisms.
According to Zainun (2007) leukocytes are a kind of blood cells that serve as non-specific defences by localising and eliminating infections. The reduction in leukocyte count following an infection is due to the migration of active leukocytes from blood vessels into the diseased tissue. The study conducted by Nuryati et al. (2010) demonstrates the ability of fish to identify and remember various types of infections that invade their bodies.
Kresno (2001) stated that an elevated leukocyte count suggests that the fish’s immune system is reacting to the existence of foreign substances in the body. An elevation in leukocyte count indicates the effectiveness of the fish’s immune system in generating a cellular and immunological response as a stimulus for an immune reaction. Suprayudi et al. (2006) suggested that fish enhance their ability to survive by augmenting the quantity of leukocytes, which serve as defensive cells. Sudiono (2014) reported that administering immunostimulants orally leads to a rise in the total WBC count. This reaction suggests that immunostimulants encourage fish to enhance their immune system by raising the quantity of leukocytes, which are involved in non-specific defensive mechanisms.
In the present study, the mean total WBC count in healthy fish treated with different immunostimulant-supplemented feeds ranged from 4077±0.93 to 7535±1.07 cells/mm3. In Aeromonas infected fish, the total WBC count with different immunostimulant mixed feeds ranges from 4342±0.87 to 7757±1.06 cells/mm3. These results demonstrated that the activities of leukocytes have decreased against bacterial infection significantly, when they were fed with different immunostimulant mixed feeds in compared to simple infection, which signifies the immunostimulatory activity of immunostimulants.
In addition, the vitamin E mixed feeds considerably enhance the white blood cell count in both healthy and Aeromonas-infected fish compared to other tested immunostimulants. The current results evident with the findings of Anderson and Jeney (1992) who observed that the injection of QAC resulted in an increase in the total WBC counts. Similarly, Harikrishnan et al. (2003) observed that elevated WBC counts in C. carpio following administration of Azardicha indica extracts. Lin et al. (2011) found that koi fish given β-1,3-glucan had noticeable increased peripheral leukocyte counts. Similarly, Sahoo and Mukherjee (2001) reported considerably higher leukocyte counts in Labeo rohita after administering β-1,3-glucan orally.
Furthermore, Sanchez-Martinez et al. (2017) found that a feed enriched with β-1,3/1,6-glucan led to a considerable increase in the number of leukocytes in Ictalurus punctatus. In their study, Selvaraj et al. (2005) found that the leukocyte counts in Cyprinus carpio remained unchanged when they were given yeast-derived β-glucan orally or by bath therapy. Indriani et al. (2020) reported that the total number of leukocytes in treatments A and B showed a greater rise compared to treatment C after receiving an immunostimulant till day 14. The post-day test challenge revealed a reduction in the overall number of leukocytes in all treatment groups of catfish when exposed to Aeromonas hydrophila.
The proportion of various cell types among the white blood cells is also a significant measure since it provides insight into the activation of the leukocytes (Fernandez et al., 2002). Leucocytes in vertebrates are classified based on their physical characteristics. This categorization allows for the identification of several types of cells, including eosinophils, basophils, lymphocytes, monocytes, and neutrophils (Ellis, 1977).
Granulocytes consist of three types of cells: eosinophils, basophils, and neutrophils. Granulocytes exhibit a response when foreign substances enter the body, although they do so without specifically recognising antigens. When an invasion occurs in tissues, these cells move and eliminate foreign particles either by phagocytosis or by destroying them through a cytotoxic reaction (Fernandez et al., 2002).
Lymphocytes possess a high metabolic capacity as a result of their many organelles in the cytoplasm, including the golgi apparatus, mitochondria, ribosomes, and endoplasmic reticulum. Lymphocytes are further categorised into B lymphocytes and T lymphocytes based on their maturation locations in the bone marrow and thymus, respectively. T cells are important for cell-mediated immunity and also aid B lymphocytes, which are accountable for producing antibodies against antigens (Ronald, 2001). Lymphocytes primarily serve to generate antibodies, establish immunological memory, and release regulatory substances known as lymphokines when subjected to the humoral and cell-specific immune systems (Campbell and Murru, 1990). Macrophages are crucial to the body's defence since they play a vital role in eliminating infections. Fernandez et al. (2002) established that macrophages, the primary phagocytic cells in fish, eliminate infections by two mechanisms: the release of harmful chemicals and phagocytosis.
In the present study, the differential blood counts of the fish fed with different immunostimulant mixed feeds under normal and Aeromonas infected conditions were performed by counting the blood cells including eosinophils, basophils, neutrophils, lymphocytes, and monocytes. The results of differential counts demonstrated that the average eosinophil, basophil, and neutrophil count in healthy fish treated with different immunostimulant-supplemented feeds ranged from 357±53.07 to 475±45.76 cells/mm3, 38±9 to 48±9 cells/mm3, and 2650±0.525 to 3340±0.49 cells/mm3 respectively.
Whereas, in Aeromonas infected fish, eosinophil, basophil, and neutrophil count with different immunostimulant mixed feeds varied between 369±50.21 to 543.66±52.51 cells/mm3, 34±6.5 to 42.6±6.02 cells/mm3, and 5060±0.89 and 7570±0.62 cells/mm3 respectively. The results of eosinophil counts indicated that the tested immunostimulants significantly increased eosinophil count in both healthy and Aeromonas infected fish when compared to the control. While, the results of basophil counts indicated that the tested immunostimulants don’t exhibit a significant impact on the basophil count in both healthy and Aeromonas infected fish when compared to the control.
Furthermore, the results of neutrophil counts demonstrated that the tested immunostimulants significantly decrease the neutrophils content in both healthy and Aeromonas infected fish when compared to the control. The results of mean lymphocyte count in healthy fish that treated with different immunostimulant mixed feeds ranged from 2531±0.79 to 3072±0.99 cells/mm3. Whereas, in Aeromonas-infected fish, the lymphocyte counts varied between 2290±1.095 and 2740±1.270 cells/mm3 with the use of different immunostimulant mixed feeds. While, the mean monocyte counts in healthy fish treated with various immunostimulant mixed feeds ranged from 178±0.64 to 370±0.51 cells/mm3. Whereas, in Aeromonas-infected fish, the monocyte counts varied between 462±0.56 and 685±0.77 cells/mm3 with the use of different immunostimulant mixed feeds. These results of lymphocyte and monocyte counts indicated that the tested immunostimulants had a substantial effect on increasing the number of lymphocytes and decreasing number of neutrophils in both healthy and Aeromonas infected fish, as compared to the control group.
The current findings are consistent with the prior research conducted by Selvaraj et al. (2005) which demonstrated that intraperitoneal administration of β-glucan led to a considerable rise in the number of peripheral neutrophils and monocytes in a manner that appeared to be dependent on the dosage. Additionally, Chin and Woo (2005) found that Atlantic salmon had lymphocytes comprising 66.4~75.1% of their blood cells, granulocytes making up 1.6~3.6%, monocytes accounting for 0.19~1.1%, and thrombocytes constituting 20.1~31.9%. Hardie et al. (1991) observed that lymphocytes accounted for 68.0~80.3% of the total count, thrombocytes accounted for 16.8~23.3%, neutrophils accounted for 2.0~7.5%, and monocytes accounted for 1.0~2.8%. Hardie et al. (1991) reported that the percentage of lymphocytes ranged from 59.7% to 65.9%, thrombocytes ranged from 30.3% to 39.1%, neutrophils ranged from 2.1% to 2.6%, and monocytes ranged from 0.9% to 1.4%.
Contrary to the current study, Wojtaszek et al. (2002) found that administering cortisol resulted in a decrease in the number of circulating lymphocytes and eosinophils, but the number of neutrophils increased. Narnaware and Baker (1996) observed a decrease in lymphocytes and thrombocytes in the bloodstream, along with an increase in neutrophils and monocytes, in rainbow trout under stress. Ellsaesser and Clem (1987) discovered a decrease in lymphocyte count that was associated with an increase in neutrophils following the administration of physiological quantities of cortisol to channel catfish. While comparing the current data to earlier reports, it is evident that there is a relatively large number of lymphocytes, but the fraction of neutrophils is lower than the expected range. The change in the erythrocyte sedimentation rate has been attributed to components present in both the plasma and red blood cells (Al-Homrany, 2002). An elevated ESR level signifies a rise in the formation of erythrocyte rouleaux, which can be harmful to red blood cells as they pass through the microcirculation (Qian et al., 2002).
In the present study, the mean ESR values in healthy fish treated with different immunostimulant mixed feeds ranged from 0.27±0.13 to 0.39±0.17 cm/hour. Whereas, in Aeromonas-infected fish, the ESR with various immunostimulant mixed feeds ranges from 0.33±0.111 to 0.45±0.14 cm/hour. The results indicated that the immunostimulants examined did not have a significant effect on the ESR in both healthy and Aeromonas infected fish, as compared to the control group. The present results align with the findings of Harkal et al. (2011) who observed a rise in ESR from 7.25 mm/h to 8.10 mm/hr over a period of 24 to 96 hours respectively, in presence of a 15-ppm concentration of aqueous garlic extract. Similarly, they noted an increase in ESR from 7.80 mm/h to 9.11 mm/h over the same time frame.
Moreover, it has been indicated that an elevation in ESR might be attributed to an augmentation in the level of fibrinogen, resulting in fibrinogenemia, which can be caused by exposure to garlic or by chemical compounds such as sulphur. Similarly, Wu et al. (2013) found that the erythrocyte sedimentation rate reduced in the groups receiving dosages of 0.5 and 1.0 g/kg. In the groups receiving dosages of 2.0 and 4.0 g/kg, the ESR reduced from days 0 to 14, but rise from days 28 to 56. Malla et al. (2009) and Kumar & Benerjee (1990) have documented an elevation in ESR in Channa punctatus and Clarias batrachus following a seven-day exposure to chlorpyrifos.
5 Conclusion
It is concluded that the infected fish fed with all the five selected immunostimulant mixed feed exhibited lower lengths than the normal fish fed with immunostimulant diets. Among all the tested feeds, Aeromonas- infected fish fed with vitamin C mixed feed exhibited greater body length gain. The tested immunostimulants significantly enhance the Hemoglobin percentage, as well as RBC, WBC, neutrophils, lymphocytes, and monocyte count; decrease the eosinophil count and not shown a significant impact on the basophils count and ESR in both healthy and Aeromonas infected fish when compared to the control feed administered group. Thus, among the above selected immunostimulants, Vitamin C and Vitamin E have shown better impact on the morphometry and haematology of Cata catla fish under Aeromonas hydrophila infected conditions and restored all the above parameters as in healthy fish.
Acknowledgements
Thanks are due to the Head of the Dept. of Zoology & Aquaculture, ANU for providing necessary facilities to carry out this work. The authors are thankful to the Co-ordinator of International Student Cell and higher authorities of Acharya Nagarjuna University for the support in completing this work.
Conflict of Interest Disclosure
The authors declare that this research was conducted without any commercial or financial relationships that could be construed as a potential conflict of interest.
Aathi K., Ramasubramanian V., Venkatachalam U., and Munirasu S., 2013, Effect of chitosan supplemented diet on survival, growth, hematological, biochemical and immunological responses of Indian major carp Labeo rohita, International Research Journal of Pharmacy, 4(5): 141-147.
https://doi.org/10.7897/2230-8407.04529
Abdel Rahman A.N., Khalil A.A., Abdallah H.M., and ElHady M., 2018, The effects of the dietary supplementation of Echinacea purpurea extract and/or vitamin C on the intestinal histomorphology, phagocytic activity, and gene expression of the Nile tilapia. Fish & Shellfish Immunology, 82: 312-318.
https://doi.org/10.1016/j.fsi.2018.08.024
Abdel-Ghany H.M., and Salem M.E.S., 2019, Effects of dietary chitosan supplementation on farmed fish; a review, Reviews in Aquaculture, 12(1): 438-452.
https://doi.org/10.1111/raq.12326
Abdelkhalek N.K., Zaki V.H. and Yousef M., 2008, Effect of some immunostimulants on health status and disease resistance of Nile tilapia (Oreochromis niloticus), Proceedings of 8th International Symposium on Tilapia in Aquaculture (ISTA VIII), pages1037-1088.
Abdel-Tawwab M., Mounes H.A., Shady S.H. and Ahmed K.M., 2020, Effects of yucca, Yucca schidigera, extract and/or yeast, Saccharomyces cerevisiae, as water additives on growth, biochemical, and antioxidants/oxidant biomarkers of Nile tilapia, Oreochromis niloticus, Aquaculture, 533: 736122.
https://doi.org/10.1016/j.aquaculture.2020.736122
Adams S.M., 2005, Assessing cause and effect of multiple stressors on marine systems. Marine Pollution Bulletin, 51: 649-657.
https://doi.org/10.1016/j.marpolbul.2004.11.040
Ahmad M.R., 1982, Leucocytes of Clarias batrachus (L). With special reference to body weight, Indian Journal of Zoology, 23(2): 105-111.
Ahmad S.I., Ahmad R., Khan M.S., Kant R., Shahid S., Gautam L., Hasan G.M. and Hassan M.I., 2020, Chitin and its derivatives: Structural properties and biomedical applications, International Journal of Biological Macromolecules, 164: 526-539.
https://doi.org/10.1016/j.ijbiomac.2020.07.098
Ahmed N. and Thompson S., 2019, The blue dimensions of aquaculture: A global synthesis, Science of the Total Environment, 652: 851-861.
https://doi.org/10.1016/j.scitotenv.2018.10.163
Al-Homrany M., 2002. The significance of extreme elevation of the erythrocyte sedimentation rate in hemodialysis patients, Saudi Journal of Kidney Diseases and Transplantation, 13(2): 141-145.
https://pubmed.ncbi.nlm.nih.gov/17660652/
Alvarez Pellitero P., Sitja Bobadilla A., Bermudez R. and Quiroga M.I., 2006, Levamisole activates several innate immune factors in Scophthalmus maximus (L.) Teleostei, International Journal of Immunopathology and Pharmacology, 19(4): 727-738.
https://doi.org/10.1177/039463200601900403
Anderson D.P. and Jeney G., 1992, Immunostimulants added to injected Aeromonas salmonicida bacterin enhance the defense mechanisms and protection in rainbow trout (Oncorhynchus mykiss). Veterinary Immunology and Immunopathology, 34(3-4): 379-389.
https://doi.org/10.1016/0165-2427(92)90177-R
Awad E., Austin D. and Lyndon A.R., 2013, Effect of black cumin seed oil (Nigella sativa) and nettle extract (Quercetin) on enhancement of immunity in rainbow trout, Oncorhynchus mykiss (Walbaum), Aquaculture, 388: 193-197.
https://doi.org/10.1016/j.aquaculture.2013.01.008
Baba T., Watase Y. and Yoshinaga Y., 1993, Activation of mononuclear phagocytes function by levamisole immersion in carp, Nippon Suisan Gakkaishi, 59: 301- 307.
https://doi.org/10.2331/suisan.59.301
Bae J.Y., Park G.H., Yoo K.Y., Lee J.Y., Kim D.J. and Bai, S.C., 2013, Evaluation of optimum dietary vitamin E requirements using DLα-tocopheryl acetate in the juvenile eel, Anguilla japonica, Journal of Applied Ichthyology, 299(1): 213-217.
https://doi.org/10.1111/jai.12001
Bai S.C., Hardy R.W. and Hamidoghli A., 2022, Diet analysis and evaluation In Fish nutrition, Academic Press, pages 709-743.
https://doi.org/10.1016/B978-0-12-819587-1.00010-0
Bairwa M.K., Jakhar J.K., Satyanarayana Y. and Reddy A.D., 2012, Animal and plant originated immunostimulants used in aquaculture, Journal of Natural Product and Plant Resources, 2(3): 397-400.
Barikani M., Oliaei E., Seddiqi H. and Honarkar H., 2014, Preparation and application of chitin and its derivatives: A review, Iranian Polymer Journal (English Edition), 23(4): 307-326.
https://doi.org/10.1007/s13726-014-0225-z
Bastiawan D., Taukhid M., Alifuddin T.S. and Dermawati, 1995, Perubahan hematologic danjaringan ikan lele dumbo Clarias gariepinus yang diinfeksi cendawan Aphanomyces spt, Jurnal Penelitian Perikanan Indonesia, 1(2): 106-115.
https://doi.org/10.15578/jppi.1.2.1995.106-115
Bhatnagar A. and Lamba R., 2016, Immunostimulating and growth promoting activity of dietary levamisole on Cirrhinus mrigala fingerlings, Journal of Aquaculure & Marine Biology, 4(6): 1-9.
https://doi.org/10.15406/jamb.2016.04.00102
Boric M., Vicente F.A., Jurkovic D.L., Novak U. and Likozar B., 2020, Chitin isolation from crustacean waste using a hybrid demineralization/DBD plasma process, Carbohydrate Polymers, 246: 1-8.
https://doi.org/10.1016/j.carbpol.2020.116648
Burrells C., Williams P., Southgate P. and Wadsworth S., 2001, Dietary nucleotides: a novel supplement in fish feeds: 2. Effects on vaccination, salt water transfer, growth rates and physiology of Atlantic salmon (Salmo salar L.), Aquaculture, 199(1-2): 171-84.
https://doi.org/10.1016/S0044-8486(01)00576-2
Campbell T. and Murru F., 1990, An introduction to fish hematology, The Compendium on Continuing Education for the Practicing Veterinarian, 12: 525-532.
https://api.semanticscholar.org/CorpusID:70951850
Chin A. and Woo P.T., 2005, Innate cell-mediated immune response and peripheral leukocyte populations in Atlantic salmon, Salmo salar L., to a live Cryptobia salmositica vaccine, Parasitology Research, 95(5): 299-304.
https://doi.org/10.1007/s00436-004-1270-x
Combs G.F. and McClung J.P., 2017, Chapter 8 vitamin E. In: Combs, G.F., McClung, J.P. (Eds.), The Vitamins, 5th edition, Academic Press, 207-242.
https://doi.org/10.1016/B978-0-12-802965-7.00008-3
Danulat E., 1987, Digestibility of chitin in cod, Gadus morhua, in vivo, Helgoländer Meeresuntersuchungen (Helgoland Marine Research), 41(4): 425-436.
https://doi.org/10.1007/BF02365402
Dash G., Raman R.P., Prasad K.P., Makesh M., Pradeep M. and Sen S., 2015, Evaluation of paraprobiotic applicability of Lactobacillus plantarum in improving the immune response and disease protection in giant freshwater prawn, Macrobrachium rosenbergii (de Man, 1879), Fish & Shellfish Immunology, 43: 167-174.
https://doi.org/10.1016/j.fsi.2014.12.007
Dawood M.A. and Koshio S., 2016, Recent advances in the role of probiotics and prebiotics in carp aquaculture: a review, Aquaculture, 454: 243-251.
https://doi.org/10.1016/j.aquaculture.2015.12.033
Defrizal D. and Khalil M., 2015, Pengaruh formulasi yang berbeda pada pakan pelet terhadap pertumbuhan ikan lele dumbo (Clarias gariepinus). Acta Aquatica, 2(2): 101-106.
https://doi.org/10.29103/aa.v2i2.342
Dewi M., Efizon D. and Eddiwan E., 2017, Morphometric, meristic and growth pattern of Osphrenemus gouramy Lac. from the pinang luar oxbow lake, buluhcina village, kampar regency, riau, Jurnal Online Mahasiswa (JOM) Universitas Riau, 4(2): 1-11.
https://api.semanticscholar.org/CorpusID:155237037
Ellis A.E., 1977, The leucocytes of fish: A review, Journal of Fish Biology, 11:453-491.
https://doi.org/10.1111/j.1095-8649.1977.tb04140.x
Ellsaesser C.F. and Clem L.W., 1987, Cortisol-induced hematologic and immunologic changes in channel catfish (Ictalurus punctatus), Comparative Biochemistry and Physiology Part A: Physiology, 87(2): 405-408.
https://doi.org/10.1016/0300-9629(87)90143-5
El-Naggar M., Salaah S., El-Shabaka H., El-Rahman A., Khalil M.T. and Suloma A., 2021, Efficacy of dietary chitosan and chitosan nanoparticles supplementation on health status of Nile tilapia, Oreochromis niloticus (L.), Aquaculture Reports, 19(4): 100628.
https://doi.org/10.1016/j.aqrep.2021.100628
Elserafy S.S., Abdel-Hameid H.N.A., Abdel-Salam A.H. and Dakrouni M.A., 2021, Effect of shrimp waste extracted chitin on growth and some biochemical parameters of the Nile tilapia, Egyptian Journal of Aquatic Biology and Fisheries, 25(1): 313-329.
https://doi.org/10.21608/ejabf.2021.143244
Esepelid S., Hjelmeland K. and Jorgensen T.O., 1987, Developmental & Comparative Immunology, Summer, 11(3): 529-537.
https://doi.org/10.1016/0145-305X(87)90042-5
Fago A., Hundahl C., Malte H. and Weber R.E., 2004, Functional properties of neuroglobin and cytoglobin. Insights into the ancestral physiological roles of globins, IUBMB Life, 56: 689-696.
https://doi.org/10.1080/15216540500037299
FAO., 2020, The State of World Fisheries and Aquaculture 2020 (SOFIA): Sustainability in action, Food and Agriculture Organization of the United Nations.
Faramarzi M., 2012, Effect of dietary vitamin C on growth and feeding parameters, carcass composition and survival rate of Common Carp (Cyprinus carpio), Global Veterinaria, 8(5): 507-510.
https://www.idosi.org/gv/GV8(5)12/14.pdf
Fernandez A.B., de Blas I. and Ruiz I., 2002, Immunological system in Teleost. Cells and organs. Aquatic Magazine, 16, Spanish.
Fines B.C. and Holt G.J., 2010, Chitinase and apparent digestibility of chitin in the digestive tract of juvenile cobia, Rachycentron canadum, Aquaculture, 303: 34-39.
https://doi.org/10.1016/j.aquaculture.2010.03.010
Gao J., Koshio S., Ishikawa M., Yokoyama S., Ren T.J., Komilus C.F. and Han Y.Z., 2012, Effects of dietary palm oil supplements with oxidized and non-oxidized fish oil on growth performances and fatty acid compositions of juvenile Japanese sea bass, Lateolabra japonicas, Aquaculture, 324: 97-103.
https://doi.org/10.1016/j.aquaculture.2011.10.031
Gephart J.A., Golden C.D., Asche F., Belton B., Brugere C., Froehlich H.E., Fry J,P., Halpern B.S., Hicks C.C., Jones R.C., Klinger D.H., Little D.C., McCauley D.J., Thilsted S.H., Troell M. and Allison E.H., 2020, Scenarios for global aquaculture and its role in human nutrition, Reviews in Fisheries Science and Aquaculture, 1-17.
https://doi.org/10.1080/23308249.2020.1782342
Giardina B., Mosca D. and De Rosa MC., 2004, The Bohr effect of haemoglobin in vertebrates: an example of molecular adaptation to different physiological requirements, Acta Physiologica Scandinavica, 182: 229-244.
https://doi.org/10.1111/j.1365-201X.2004.01360.x
Gouda A, Amer S.A., Gabr S., Tolba S.A., 2020, Effect of dietary supplemental ascorbic acid and folic acid on the growth performance, redox status, and immune status of broiler chickens under heat stress. Tropical A'NIMAL Health and Production, 52(6): 2987-2996.
https://doi.org/10.1007/s11250-020-02316-4
Hardie L., Fletcher T. and Secombes C., 1990, The effect of vitamin E on the immune response of the Atlantic salmon (Salmo salar L.), Aquaculture, 87(1): 1-13.
https://doi.org/10.1016/0044-8486(90)90206-3
Hardie L., Fletcher T. and Secombes C., 1991, The effect of dietary vitamin C on the immune response of the Atlantic salmon (Salmo salar L.), Aquaculture, 95(3-4): 201-214.
https://doi.org/10.1016/0044-8486(91)90087-N
Harikrishnan R., Nisha R.M. and Balasundaram C., 2003, Hematological and biochemical parameters in common carp, Cyprinus carpio, following herbal treatment for Aeromonas hydrophila infection, Aquaculture, 221(1-4): 41-50.
https://doi.org/10.1016/S0044-8486(03)00023-1
Harkal A.B., Jagtap A.R., Padewar S.K. and Mali R.P., 2011, Toxic effect of aqueous extract of garlic on erythrocyte sedimentation rate in fish, Channa punctatus, The Asian Journal of Animal Science, 6(2): 206-207.
https://researchjournal.co.in/upload/assignments/6_206-207.pdf
Haryono, 2001, Variasi Morfologi dan Morfometri Ikan Dokun (Puntius Lateristriga) di Sumatera, Jurnal Biota, 6(3): 109-116.
Hassan A., Yacout M.H.M., Khalel M.S., Hafsa S.A., Ibrahim M.A.R., Mocuta D., Rahoveanu A.T. and Lorena D., 2018, Effects of some herbal plant supplements on growth performance and the immune response in tilapia (Oreochromis niloticus). Sciendo, 1(1): 134-141.
https://doi.org/10.2478/alife-2018-0020
He M., Wang K., Liang X., Fang J., Geng Y., Chen Z., Pu H., Hu Y., Li X. and Liu L. 2017, Effects of dietary vitamin E on growth performance as well as intestinal structure and function of channel catfish (Ictalurus punctatus, Rafinesque 1818), Experimental and Therapeutic Medicine, 14(6): 5703-5710.
https://doi.org/10.3892/etm.2017.5295
Hoseinifar S.H., Dadar M. and Ringo E., 2017, Effect of β-glucan on growth performance, hematological parameters, and skin mucus immune responses in common carp (Cyprinus carpio) fingerlings, Fish & Shellfish Immunology, 67: 119-124.
https://doi.org/10.1016/j.fsi.2017.06.023
Hudson I. and Hay C.F., 1991, Antibody interaction with antigen. In: Practical immunology, 3rd edition, Blackwell Scientific Publications, Oxford, pages 208-260.
Ibrahim R.E., Ahmed S.A., Amer S.A., Al-Gabri N.A., Ahmed A.I., Abdel-Warith A.W.A., Younis E.S.M. and Metwally, A.E., 2020, Influence of vitamin C feed supplementation on the growth, antioxidant activity, immune status, tissue histomorphology, and disease resistance in Nile tilapia, Oreochromis niloticus, Aquaculture Reports, 18: 100545.
https://doi.org/10.1016/j.aqrep.2020.100545
Indriani F., Puspitasari I., Setyastuti T.A. and Santika A., 2020, Haematological parameters of Catfish (Clarias sp.) fed by immunostimulant added with Cr+ 3-Yeast (Saccaromices cerevisiae) and Garlic, In IOP Conference Series: Earth and Environmental Science, IOP Publishing, 441(1): 012115.
https://doi.org/10.1088/1755-1315/441/1/012115
Ismail H.M., 2005, The role of omega-3 fatty acids in cardiac protection: an overview, Frontiers in Bioscience, 10: 1079-1088.
James R., Vasudhevan I. and Sampath K., 2008, Effect of dietary vitamin E on growth, fecundity, and leukocyte count in goldfish (Carassius auratus), The Israeli Journal of Aquaculture - Bamidgeh, 60(2): 121-127.
https://doi.org/10.46989/001c.20485
Janssen PA., 1976, The levamisole story. Progress in Drug Research, 20: 347-383.
https://doi.org/10.1007/978-3-0348-7094-8_11
Jeney G. and Anderson D.P., 1993, Enhanced immune response and protection in rainbow trout to Aeromonas salmonicida bacterin following prior immersion in immunostimulants, Fish and Shellfish Immunology, 3(1): 51-58.
https://doi.org/10.1006/fsim.1993.1005
Khattabya., Shalabyame., Sharafsm., El Marakbyhi. and Rizkallaeh., 2004, The physiological changes and growth performance of the Nile tilapia Oerochromis niloticus after feeding with Biogen® as growth promoter. Egyptian Journal of Aquatic Biology and Fisheries, 8: 145-158.
Kono M., Shimizu C. and Matsui T., 1987, Effect of chitin, chitosan, and cellulose as diet supplements on the growth of Cultured Fish, Nippon Suisan Gakkaishi, 53(1): 125-129.
https://doi.org/10.2331/suisan.53.125
Kresno S.B., 2001, Imunologi: Diagnosis dan Prosedur Laboratorium (Jakarta: Universitas Indonesia).
Kumar B. and Benerjee V., 1990, Effect of sub lethal toxicity of seven on blood parameters in Clarias batrachus (L.), Himalayan Journal of Environment and Zoology, 4: 166-172.
Kumar R., Mukherjee S.C., Ranjan R. and Nayak S.K., 2008, Enhanced innate immune parameters in Labeo rohita (Ham.) following oral administration of Bacillus subtilis, Fish & Shellfish Immunology, 24(2): 168-172.
https://doi.org/10.1016/j.fsi.2007.10.008
Kumar V., Sahu N.P., Pal A.K. and Kumar S., 2006, Immunomodulation of Labeo rohita juveniles due to dietary gelatinized and nongelatinized starch, Fish & Shellfish Immunology, 23: 341-353.
https://doi.org/10.1016/j.fsi.2006.11.008
Landini G.F., Schwantes A.R. and Schwantes M.L.. 2002, Astyanax scabripinnis (Pisces: Characidae) hemoglobins: structure and function, Brazilian Journal of Biology, 62: 595-599.
https://doi.org/10.1590/S1519-69842002000400006
Lin S., Pan Y., Luo L. and Luo L., 2011, Effects of dietary β-1, 3-glucan, chitosan or raffinose on the growth, innate immunity and resistance of koi (Cyprinus carpio koi), Fish & Shellfish Immunology, 31(6): 788-794.
https://doi.org/10.1016/j.fsi.2011.07.013
Liua B., Wana J., Gea X., Xiea J., Zhoub Q., Miaob L., Renb M. and Panb L., 2016, Effects of dietary Vitamin C on the physiological responses and disease resistance to pH stress and Aeromonas hydrophila infection of Megalobrama amblycephala, Turkish Journal of Fisheries and Aquatic Sciences, 16: 421-433.
https://doi.org/10.4194/1303-2712-v16_2_22
Lu Y., Liang X.P., Jin M., Sun P., Ma H.N., Yuan Y. and Zhou Q.C. 2016, Effects of dietary vitamin E on the growth performance, antioxidant status and innate immune response in juvenile yellow catfish (Pelteobagrus fulvidraco), Aquaculture, 464: 609-617.
https://doi.org/10.1016/j.aquaculture.2016.08.009
Malla F.A., Sharma G. and Singh S., 2009, Chlorpyrifos pesticide toxicity on erythrocyte sedimentation rate in fish, Channa punctatus (Bloch), Biology & Medicine, 1(2): 54-55.
Mansour A.T., Fayed W.M., Elkhayat B.K., Ali E., Omar M.A., Nour A.A.M. and Morshedy S.A., 2021, Yucca schidigera extract dietary supplementation affects growth performance, hematological and physiological status of European seabass, Annals of Animal Science, 21: 1043-1060.
https://doi.org/10.2478/aoas-2021-0007
Maqsood S., Samoon M.H. and Singh P., 2009, Immunomodulatory and growth promoting effect of dietary levamisole in Cyprinus carpio fingerlings against the challenge of Aeromonas hydrophila, Turkish Journal of Fisheries and Aquatic Sciences, 9:111-120.
Maqsood S., Singh P., Samoon M.H. and Balange A.K., 2010, Effect of Dietary Chitosan on non-Specific immune response and growth Cyprinus carpio Challenged with Aeromonas hydrophila, International Aquatic Research, 2: 77-85.
Martins M.L., Tavares-Dias M., Fujimoto R.Y., Onaka E.M. and Nomura DT., 2004, Haematological alterations of Leporinus macrocephalus (Osteichtyes: Anostomidae) naturally infected by Goezia leporini (Nematoda: Anisakidae) in fish pond, Arquivo Brasileiro de Medicina Veterinária e Zootecnia, 56: 640-646.
https://doi.org/10.1590/S0102-09352004000500011
Mehrad B., Jafaryan H. and Taati M.M., 2012. Assessment of the effects of dietary vitamin E on growth performance and reproduction of zebrafish, Danio rerio (Pisces, Cyprinidae), Journal of Oceanography and Marine Science, 3(1): 1-7.
https://doi.org/10.5897/JOMS11.022
Muahiddah N. and Diamahesa W.A., 2023, The use of garlic (Allium sativum) as an immunostimulant in Aquaculture, Journal of Fish Health, 3(1): 11-18.
https://doi.org/10.29303/jfh.v3i1.2751
Mudjiman A., 2011, Makanan Ikan (Fish Feed/Fish Food). Penebar Swadaya, Jakarta, Indonesia.
Mulero V., Esteban M.A., Munoz J. and Meseguer J., 1998, Dietary intake of levamisole enhances the immune response and disease resistance of the marine teleost gilthead seabream (Sparus aurata L.), Fish & Shellfish Immunology, 8(1): 49-62.
https://doi.org/10.1006/fsim.1997.0119
Narnaware Y. and Baker B., 1996, Evidence that cortisol may protect against the immediate effects of stress on circulating leukocytes in the trout, General and Comparative Endocrinology, 103(3): 359-66.
https://doi.org/10.1006/gcen.1996.0131
Niki L., Albright L.J. and Evelyn T.P.T., 1991, Influence of seven immunostimulants on the immune response of Coho salmon to Aeromonas salmonicida, Diseases of Aquatic Organisms, 12(1): 7-12.
https://doi.org/10.3354/dao012007
Nolle N., Genschick S., Schwadorf K., Hrenn H., Brandner S. and Biesalski H.K., 2020, Fish as a source of (micro)nutrients to combat hidden hunger in Zambia, Food Security, 12(6): 1385-1406.
https://doi.org/10.1007/s12571-020-01060-9
Novian F., Grandiosa R. and Pratiwi D.Y., 2023. Growth Performance and Health Status of Giant Gouramy (Osphronemus gouramy Lac.) Seed feeded with a combination of chitosan and probiotic supplements (sinbiotic). Jurnal Ruaya: Jurnal Penelitian dan Kajian Ilmu Perikanan dan Kelautan, 11(1): 52-63.
https://doi.org/10.29406/jr.v11i1.4754
NRC., 2011, National Research Council, Division on Earth, Life Studies, Committee on the Nutrient Requirements of Fish and Shrimp, Nutrient requirements of fish and shrimp, National Academies Press.
Nuryati S., Maswan N.A., Alimuddin S., Sumantadinata K., Pasaribu F.H., Soejoedono R.D. and Santika A., 2010, Gambaran darah ikan mas setelah divaksinasi dengan vaksin DNA dan diuji tantang dengan koi herpes virus, Jurnal Akuakultur Indonesi, 9(1): 9-15.
https://doi.org/10.19027/jai.9.9-15
Padua S.B., Martins M.L., Menezes-Filho R.N. and Nagata M.M., 2015, Uso de Aquate FishTM durante a formação de juvenis de tilápia: aumento da resistência contra doenças, melhoria na integridade intestinal e no desempenho produtivo. Revista Aqua Feed, pp 4-8.
Payung C.N., Tumbol R.A. and Manoppo H., 2017, Dietary ginger (Zingiber officinale) enhance resistance of Nile tilapia (Oreochromis niloticus) against Aeromonas hydrophila, AACL Bioflux, (4): 962-968.
Peng L.I. and Gatlin III D.M., 2009, Dietary vitamin E requirement of the red drum Sciaenops ocellatus, Aquaculture Nutrition, 15: 313-319.
https://doi.org/10.1111/j.1365-2095.2008.00596.x
Perutz M.F., 1978, Hemoglobin structure and respiratory transport, Scientific American, 239: 92-125.
https://doi.org/10.1038/scientificamerican1278-92
Pulungan LA., Riauwaty M. and Lukistyowati I., 2022, Hematology of pangasianodon hypophthalmus that were fed with containing fermented red ginger (Zingiber officinale var. rubrum) to prevent the motile Aeromonas septicaemia disease, Asian Journal of Aquatic Sciences, 5(2): 291-300.
https://doi.org/10.31258/ajoas.5.2.291-300
Purbomartono C., Habibah U., Wahyuningtyas R.A., Husin A. and Samadan G,M., 2021, Growth and immunity of African catfish (Clarias gariepinus) with dietary inclusion of ginger (Zingiber officinalis) and turmeric (Curcuma domestica), AACL Bioflux, 14(3): 1365-1372.
Qian Y.X., Chen H.Q. and Sun J.F., 2002, Effects of starvation on hematological and blood biochemical indices in cultured Lateolabrax japonicus, Journal of Fishery Sciences of China, 9(2): 133-137.
Rairakhwada D., Pal A.K., Bhathena Z.P., Sahu N.P., Jha A. and Mukherjee S.C., 2007, Dietary microbial levan enhances cellular nonspecific immunity and survival of common carp (Cyprinus carpio) juveniles, Fish & Shellfish Immunology, 22: 477-486.
https://doi.org/10.1016/j.fsi.2006.06.005
Ramesh D., Vinothkanna A., Rai A.K. and Vignesh V.S., 2015, Isolation of potential probiotic Bacillus spp. and assessment of their subcellular components to induce immune responses in Labeo rohita against Aeromonas hydrophila, Fish & Shellfish Immunology, 45: 268-276.
https://doi.org/10.1016/j.fsi.2015.04.018
Reda R.M. and Selim K.M., 2015, Evaluation of Bacillus amyloliquefaciens on the growth performance, intestinal morphology, hematology and body composition of Nile tilapia, Oreochromis niloticus, Aquaculture International, 23: 203-217.
https://doi.org/10.1007/s10499-014-9809-z
Refaey M.M., Mehrim A.I., Zenhom O.A. and Mansour A.T., 2022, Effect of fatty acids manipulation on survival and physiological response of hybrid red tilapia under chronic cold stress, Aquaculture, 561: 738663.
https://doi.org/10.1016/j.aquaculture.2022.738663
Riggs A., 1976, Factors in the evolution of hemoglobin function. Federation Proceedings, 35(10): 2115-2118.
Ringo E., Lovmo L., Kristiansen M., Bakken Y., Salinas I., Myklebust R., Olsen R.E. and Mayhew T.M., 2010, Lactic acid bacteria vs. pathogens in the gastro-intestine of fish: a review. Aquaculture Research, 41:451-467.
https://doi.org/10.1111/j.1365-2109.2009.02339.x
Ringo E., Olsen R.E., Vecino J.G., Wadsworth S. and Song S., 2012, Use of immunostimulants and nucleotides in aquaculture: a review. Journal of Marine Science Research & Development, 2(1): 1000104.
https://doi.org/10.4172/2155-9910.1000104
Rodrıguez A., Cuesta A., Ortuno J., Esteban M.A. and Meseguer J., 2003, Immunostimulant properties of a cell wall-modified whole Saccharomyces cerevisiae strain administered by diet to seabream (Sparus aurata L.), Veterinary Immunology and Immunopathology, 96(3-4): 183-192.
https://doi.org/10.1016/j.vetimm.2003.07.001
Rohani M.F., Tarin T., Hasan J., Islam S.M. and Shahjahan M., 2023, Vitamin E supplementation in diet ameliorates growth of Nile tilapia by upgrading muscle health, Saudi Journal of Biological Sciences, 30(2): 103558.
https://doi.org/10.1016/j.sjbs.2023.103558
Ronald R., 2001, Fish Pathology. 4th edition. Wiley-Blackwell, 590 pages.
Rozi R., Mukti A.T., Samara S.H. and Santanumurti M.B., 2018, Pengaruh pemberian kitosan dalam pakan terhadap pertumbuhan, sintasan dan efisiensi pemanfaatan pakan nila (Oreochromis niloticus), Jurnal Perikanan Universitas Gadjah Mada, 20(2): 103-111.
https://doi.org/10.22146/jfs.38868
Saheli M., Islami H.R., Mohseni M. and Soltani M., 2021. Effects of dietary vitamin E on growth performance, body composition, antioxidant capacity, and some immune responses in Caspian trout (Salmo caspius). Aquaculture Reports, 21: 100857.
https://doi.org/10.1016/j.aqrep.2021.100857
Sahoo P. and Mukherjee S., 2001, Effect of dietary β-1,3 glucan on immune responses and disease resistance of healthy and aflatoxin B1-induced immunocompromised rohu (Labeo rohita Hamilton), Fish & Shellfish Immunology, 11(8): 683-695.
https://doi.org/10.1006/fsim.2001.0345
Sakai M., 1999, Current research status of fish immunostimulants, Aquaculture, 172(1-2): 63-92.
https://doi.org/10.1016/S0044-8486(98)00436-0
Salam M.A., Rahman M.A., Paul S.I., Islam F., Barman A.K., Rahman Z., Shaha D.C., Rahman M.M. and Islam T., 2021, Dietary chitosan promotes the growth, biochemical composition, gut microbiota, hematological parameters and internal organ morphology of juvenile Barbonymus gonionotus, PLoS One, 16(11): e0260192.
https://doi.org/10.1371/journal.pone.0260192
Sanchez-Martínez J.G., Rábago-Castro J.L., Vázquez-Sauceda M.de.la.L., Pérez-Castañeda R, Blanco-Martínez Z. and Benavides-González F., 2017, Effect of β-glucan dietary levels on immune response and hematology of channel catfish Ictalurus punctatus juveniles, Latin American Journal of Aquatic Research, 45(4):690-698.
https://doi.org/10.3856/vol45-issue4-fulltext-5
Saputra A., Budiardi T., Samsudin R. and Rahmadya N.D., 2018, Growth performance and survival of snakehead Channa striata juvenile with different stocking density reared in recirculation system. Jurnal Akuakultur Indonesia, 17(2): 104-112.
https://doi.org/10.19027/jai.17.2.104-112
Sarker U.K., Hossain M.I., Hossain M.M., Sarkar R., Rahman M.M., Abdullah-Al-Mamun M.,Alam MM., 2023, Effects of major immunostimulant (Betamune) on health and production of Nile tilapia Oreochromis niloticus. International Journal of Fisheries and Aquatic Studies, 11(3): 7-16.
https://doi.org/10.22271/fish.2023.v11.i3a.2802
Selvaraj V., Sampath K. and Sekar V., 2005, Administration of yeast glucan enhances survival and some non-specific and specific immune parameters in carp (Cyprinus carpio) infected with Aeromonas hydrophila, Fish & Shellfish Immunology, 19(4): 293-306.
https://doi.org/10.1016/j.fsi.2005.01.001
Setijaningsih L., Setiadi E. and Taufik I., 2021, The effect of garlic Allium sativum addition in feed to the growth performance and immune response of tilapia Oreochromis niloticus. In IOP Conference Series: Earth and Environmental Science, 744(1): 012072.
https://doi.org/10.1088/1755-1315/744/1/012072
Shiau S.Y. and Yu Y.P., 1999, Dietary supplementation of chitin and chitosan depresses growth in tilapia, Oreochromis niloticus × O. aureus, Aquaculture, 179(1-4): 439-446.
https://doi.org/10.1016/S0044-8486(99)00177-5
Simic M.G. and Karel M., 1980, Autoxidation in Food and Biological Systems. Plenum Press, New York, NY.
https://doi.org/10.1007/978-1-4757-9351-2
Siwicki A.K. and Korwin-Kossakomski M., 1988, The influence of levamisole on the growth of carp (Cyprinus carpio) larvae. Journal of Applied Ichthyology, 4(4): 178-181.
https://doi.org/10.1111/j.1439-0426.1988.tb00559.x
Smith V.J., Brown J.H. and Hauton C., 2003, Immunostimulation in crustaceans: does it really protect against infection?. Fish & Shellfish Immunology, 15(1): 71-90.
https://doi.org/10.1016/S1050-4648(02)00140-7
Sudiono J., 2014, Sistem kekebalan tubuh (The Immune System), Penerbit Buku Kedokteran EGC, Jakarta, pp 52-54.
Suprayudi M.A., Indriastuti L. and Setiawati M., 2006, Pengaruh penambahan bahan-bahan imunostimulan dalam formulasi pakan buatan terhadap respon imunitas dan pertumbuhan ikan kerapu bebek (Cromileptes altivelis), Jurnal Akuakultur Indonesia, 5(1): 77-86.
https://doi.org/10.19027/jai.5.77-86
Talpur A.D., Ikhwanuddin M.H.D. and Bolong A.A., 2013, Nutritional effects of ginger (Zingiber officinale Roscoe) on immune response of Asian seabass, Lates calcarifer (Bloch) and disease resistance against Vibrio harveyi, Aquaculture, 400-401: 46-52.
https://doi.org/10.1016/j.aquaculture.2013.02.043
Taveekijakarn P., Miyazaki T., Matsumoto M. and Arai S., 1996, Study on vitamin E deficiency in amago salmon, Bulletin of the Faculty of Bioresources Mie University, 16: 17-24.
Udo I.U., Etukudo U. and dan Anwana U.I.U., 2018, Effects of Chitosan and Chitosan Nanoparticles on Water Quality, Growth Performance, Survival Rate and Meat Quality of the African Catfish, Clarias gariepinus. Nanoscience, 1(1): 12-25.
https://doi.org/10.31058/j.nano.2018.11002
Viarengo A., Lowe D., Bolognesi C., Fabbri E. and Koehler A., 2007, The use of biomarkers in biomonitoring: A 2-tier approach assessing the level of pollutant-induced stress syndrome in sentinel organisms, Comparative Biochemistry and Physiolooy Part C: Toxicology & Pharmacology, 146: 281-300.
https://doi.org/10.1016/j.cbpc.2007.04.011
Wassef E., El Masry M.H. and Mikhail F.R., 2001, Growth enhancement and muscle structure of striped mullet, Mugil cephalus L., fingerlings by feeding algal meal-based diets. Aquaculture Research, 32: 315-322.
https://doi.org/10.1046/j.1355-557x.2001.00043.x
Wojtaszek J., Dziewulska-Szwajkowska D., Łozińska-Gabska M., Adamowicz A. and Dżugaj A., 2002, Hematological effects of high dose of cortisol on the carp (Cyprinus carpio L.): cortisol effect on the carp blood, General and Comparative Endocrinology, 125(2): 17683.
https://doi.org/10.1006/gcen.2001.7725
Wu Z.X., Pang S.F., Chen X.X., Yu Y.M., Zhou J.M., Chen X., Pang LJ., 2013, Effect of Coriolus versicolor polysaccharides on the hematological and biochemical parameters and protection against Aeromonas hydrophila in allogynogenetic crucian carp (Carassius auratus gibelio), Fish Physiology and Biochemistry, 39: 181-190.
https://doi.org/10.1007/s10695-012-9689-y
Xu C.M., Yu H.R., Li L.Y., Li M., Qiu X.Y., Fan X.Q., Fan Y.L. and Shan L.L., 2022, Effects of dietary vitamin C on the growth performance, biochemical parameters, and antioxidant activity of Coho Salmon Oncorhynchus kisutch (Walbaum, 1792) postsmolts, Aquaculture Nutrition, 6866578.
https://doi.org/10.1155/2022/6866578
Yossa R., Levesque S., Groman D.B. and Lora J.H., 2018, Preliminary evaluation of purified lignin and hemicellulose as prebiotics candidates for Atlantic Salmon, Salmo salar L., Journal of Applied Aquaculture, 30(3): 256-271.
https://doi.org/10.1080/10454438.2018.1439795
Zainun Z., 2007, Pengamatan Parameter Hematologi Pada Ikan Mas yang Diberi Imunostimulan, Buletin Teknisi Litkayasa Akuakultur, 6(1): 45-49.
https://doi.org/10.15578/blta.6.1.2007.45-49
Zaki M.A., Salem M.E.S., Gaber M.M. and Nour A.M., 2015, Effect of chitosan supplemented diet on survival, growth, feed utilization, body composition & histology of sea bass (Dicentrarchus labrax), World Journal of Engineering and Technology, 3(4): 38-47.
https://doi.org/10.4236/wjet.2015.34C005
Zhao M., He H., Guo D., Zhang X., Jia L., Hou T. and Ma A., 2022, Chitosan oligosaccharides-tripolyphosphate microcapsules as efficient vehicles for desalted duck egg white peptides-calcium: fabrication, entrapment mechanism and in vivo calcium absorption studies, Food Science & Technology, 154: 112869.
https://doi.org/10.1016/j.lwt.2021.112869
Zhou Q., Wang L., Wang H., Xie F. and Wang T., 2012, Effect of dietary vitamin C on the growth performance and innate immunity of juvenile cobia (Rachycentron canadum), Fish & Shellfish Immunology, 32(6): 969-975.
https://doi.org/10.1016/j.fsi.2012.01.024
Zhu K., Shi S., Cao Y., Lu A., Hu J. and Zhang L., 2019, Robust chitin films with good biocompatibility and breathable properties, Carbohydrate Polymers, 212: 361-367.
https://doi.org/10.1016/j.carbpol.2019.02.054



. PDF(1970KB)
. FPDF(win)
. FPDF(mac)
. HTML
. Online fPDF
Associated material
. Readers' comments
Other articles by authors
. Eisay Ali K.A.

. Sriteja G.
. Sunita K.
Related articles
. Aeromonas hydrophila
. Catla catla
. Haematology
. Immunostimulants
. Morphometry
Tools
. Email to a friend
. Post a comment